Intraday Market Thoughts Archives
Displaying results for week of Jan 16, 2022Bond Market Calling Fed
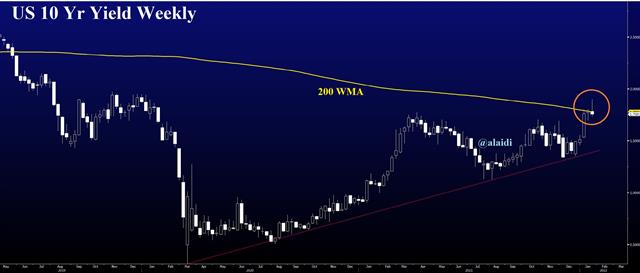
Does the chart below suggest yields have topped for now? A weekly candle that fails to close below the 200-WMA after testing ir for the 1st time in nearly 2 years could be a tell. Bonds have often foretold shifts by the Fed--policy reversals, or hard stops in this case. The US yield curve started flattening 12 mths after the end of the 2020 recession. The 10-2 curve never began flattening so soon and so deep after the end of a recession. This only highlights the unsustainable and elusory nature of the past 24 mths . A prolonged drop in yields next week could accompany a catch-down by the S&P500 and DOW30 with its Tech peer and print their own 10% drawdown at 4300 and 33000 respectively. Falling yields could be brought about by a sudden turn to the worse on the Russia-Ukraine front. More realistically, it could result from Fed Chair Powell sounding unfazed by the market turmoil on Wednesday's FOMC presser, as the curve flattens further. Think about it. Bitcoin meanwhile, could well retest the $30K support but the recovery should emerge faster and more "violently" than the March decline of 2021. Finally, gold and silver continue to do everything "right" so far.

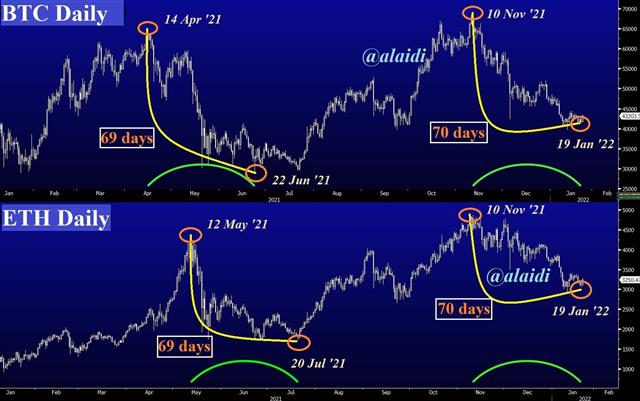
69 days vs 70 days
You've already watched this week's video on 11-week cycles in Bitcoin and Ethereum. The daily version of those cycles is in the below chart, showing 69 days last year and 70 days in the latest downcycle. Combining today's rally in BTC and ETH with the SPX recovery above its 100-DMA seems like a powerful technical confluence for the bulls. Buy-the-dip justification may grow stronger when adding Nasdaq's bounce from its 10% top-to-bottom decline. All this sounds great, but more obstacles remain ahead. US 10-year yields having broken above their 200-week MA, such occurence could be similar to the break of Nov 2016, when higher yields made their presence felt in tech stocks. Let's keep an eye on the following levels of confluence; 4550 on SPX 40K on BTC and please rewatch the role of indices alongside crypto cycles after 1:30 mins of the video.

11 Week Cycle Meets 100 DMA
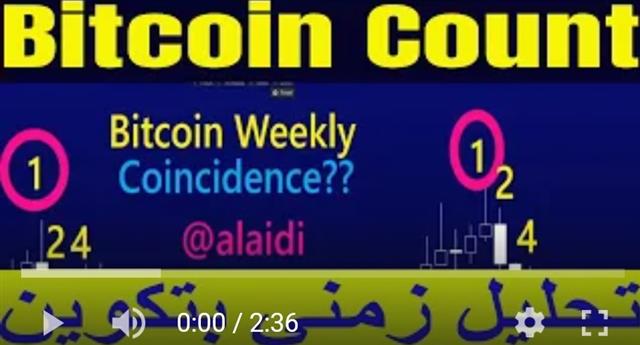
Will the 11-week cycle strike again? Full video هل هذا أسبوع القاع لبتكوين و إثيريوم؟
Latest USDJPY تحديث
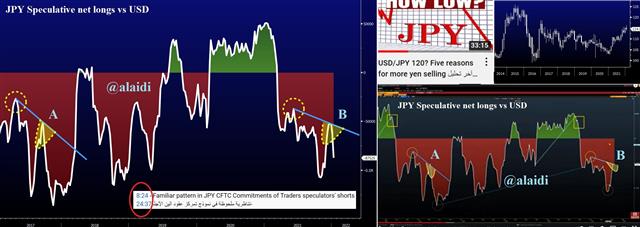
Last week's tumble in USDJPY was the perfect product of broad USD weakness and overall JPY rebound, as US indices dropped across the board. Friday's bounce from the 55-DMA is a familiar occurence for USDJPY (as was the case in late Nov 2021, mid April 2021 and October 2018). According to the latest report from the CFTC commitment of traders, overall net shorts in JPY vs USD continue to escalate (see B in lower left chart). This could follow the same pattern as that seen in mid 2017 (A). For more detail on this pattern, watch from 8:24 in this video.


