Intraday Market Thoughts Archives
Displaying results for week of Jul 24, 2022Trading Narratives vs Stats

Hawkish traders (bond bears) may not disagree with the doves, but will point to an additional 75-100 bps in rate hikes in September and November, followed by a December pause. This means there is plenty of time for consolidation in USD pairs and periodic rebounds in yields, even if 3.40-50% on the 10-yr may not be seen again.
When is that recession coming?
It will come. But traders should be more concerned with the timing of Fed rate cuts (or one rate cut), rather than the official announcement of recession -- usually a futile outdated even. It's also likely that any recession will be short-lived, that by the time the NBER announces it, we'd be out of it. So when is the next rate cut? In my last post about yield curves, I indicated that out of the 4 popular measures of US yield curves, 3 have clearly entered inversions, with the exception of the 10yr/3mth spread. Since the post, the 10yr/3mth has fallen from 75 bps to 20 bps, before rebounding to 35 bps. Why is this particular yield curve measure such a big deal? Each time it inverted (fell below zero), the US entered recession 10-15 months later, which means Fed easing would start 4-6 months prior to that, thereby fitting January 2023. Or, they could wait for the March meeting with the latest dot plots.
Tell me about levels
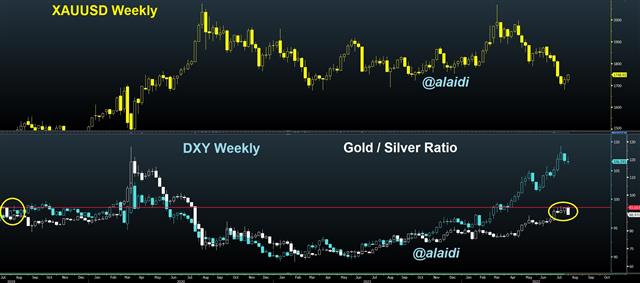
Let's start with gold. It appears the yellow metal will show another major August inflection point, as it has done in 2021, 2018, 2020, 2019, 2018, 2017 and 2016. Before you rush to correct me, I said “inflection”, not peak or trough. Or, I may be wrong and the bottom was already seen last week. Anyway, you get the idea.
The head and shoulder formation in US 10-yr yields and USDJPY becomes more apparent every day, and Wednesday confirmed that point in USDJPY.
Things we told our WhatsApp Broadcast Group
Long gold right after the Fed decision as well as NASDAQ were among the trades we shared with our WGP. The 10-yr yield neckline is making USDJPY an obvious short. But there's more to it than all that.


