Intraday Market Thoughts Archives
Displaying results for week of Apr 12, 2020Drug Sparks Hope, China Contracts
An article on the effectiveness of Gildead drug Remdesivir in treating COVID-19 sparked a jump in risk assets late Wednesday. The Canadian dollar was the top performer while the yen lagged. China's GDP shrank by 6.8% in Q1, posting the first contraction in over 4 decades. (More below).Both of the trades in DOW30 and EURUSD were stopped out. A new trade will be issued ahead of the US cash open.

Markets generally chopped sideways Wednesday until a late-breaking report on a treatment for coronavirus boosted yen crosses.
A video leaked to STAT showed University of Chicago researchers talking about a trial of 125 patients including 113 with severe cases. They said that “most” had recovered and only two died. The officials in the private video cautioned against drawing conclusions but the market hasn't.
Stock futures jumped 2.5% and yen crosses climbed, albeit more cautiously. The company has previously said it expects to publish preliminary results some time this month. If confirmed, the news could be a game-changer. An effective therapy would dramatically tilt the balance towards re-opening economies quickly and encouraging people to interact.
At the same time, the economic damage in the current situation continues to come into focus. US jobless claims rose by another 5.2 million and the April Philly Fed hit a 40-year low of -56.6.
China's GDP contraction data maybe a rear-view mirror, but serves as a crucial data point that's relevant for how the consumer will respond to re-opening the economy. The GDP figures will likely force Beijing to issue additional stimulus to avoid a contraction in Q2 GDP, which would mean a recession.
Darkening Macro Picture, Soaring Bank Loan Losses
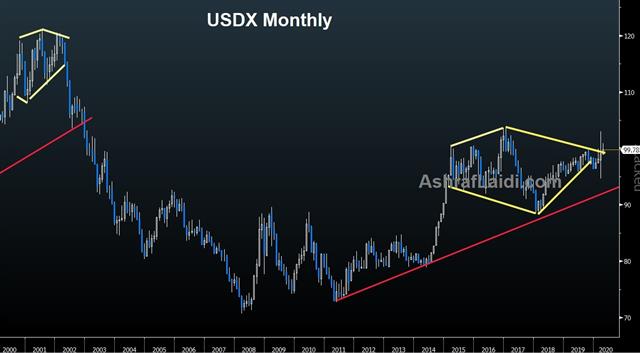
A shocking fall in the Empire Fed and some of the details of the US retail sales report illustrated the speed of the economic slowdown. The US dollar was the top performer while the Australian dollar lagged. US banks' loan loss provisions soared, with the BoA, Citigroup and Goldman taking $12.8bn of charges in Q1. These figures should imply sharp blow to the once-solid consumer sector. (more below) Oil and indices futures took a fresh dip moments ago after the release of newly-reported US figures on coronavirus, with deaths hitting 2,492 from Tuesday's 2,299 and 1,901 one week ago. Australian jobs and US initial jobless claims are due up next. There are 5 Premium trades currently open in FX, indices and crypto; 3 in the green, 1 flat and 1 in the red.
موازنة الانتظار مع التنفيذ فيديو للمشتركين
The Empire Fed report was expected to sink. It's an indicator that's close to real-time and it surveys manufacturing in the New York area, which is the current epicenter of the global outbreak. Yet no one thought it would be this bad.
The consensus estimate was for a fall to -35 from 21 in March. That would have been narrowly lower than the -34.3 bottom during the financial crisis. There were 43 estimates in the Bloomberg survey of economists and the worst was -60. Only two were below -45. The result was -78.2.It's a massive miss and it could harken a broader transition in the market where the focus moves to the economic crisis, rather than the financial one.
With regards to those bank loan loss provisions, not only they slashed US bank profits in half, but would also imply a lasting recession well into 2021. The blow to the US consumer is too grea, Not to mention additional loan losses in Q2 and Q3.
More evidence was in the March retail sales report. The headline at -8.7% compared to -8.0% expected was much closer to the consensus but it was still the worst monthly drop on record. It's within the data where there are hints on the state of the consumer. Spending on clothing was down 50.7%, Vehicles 25.6% and electronics 15%. The economy wasn't closed until halfway through the month.
As for market moves, the US dollar rebounded sharply, particularly against the commodity currencies. AUD/USD fell more than 2% after seven days of gains. The Canadian dollar also gave back much of its recent strength. That was helped by a surprise announcement of more QE from the Bank of Canada and another decline in oil prices.
In the day ahead, economic data will continue to be top-of-mind. The Australian March employment report is at 0130 GMT and forecast to show 30,000 job losses. Then at 1230 GMT it's US weekly jobless claims with another 5.5m job losses expected. That report will be a good test of the market's sensitivity to data, good or bad.
Metals Broaden Rally, USD Extends Slide
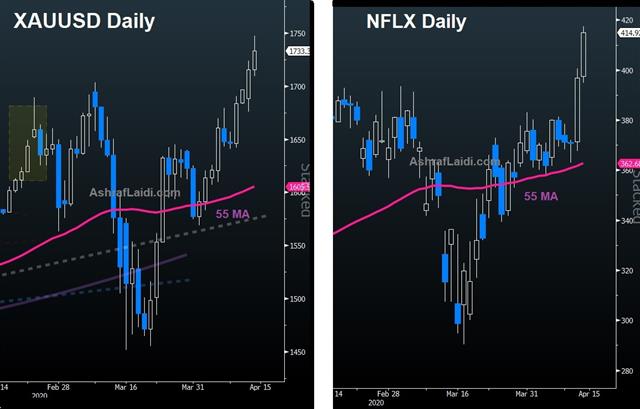
Gold broke the March highs to resume its rally for the 4th straight day, hitting an 8-year high of $1747. USD funding stress eased further, prompting traders to revert towards proactively buying metals. Silver continue to rise vs Gold and USD as XAGUSD further broke Feb trendline resistance. especially as the US deficit is widely estimated to reach $3.8 trillion this year with debt hitting 100% of GDP. As equities show more optimism on slowing growth of corona virus cases, will the same rationalisation applies to the upcoming dismal earnings season? A new Premium trade was issued earlier, supported by 3 charts and notes.

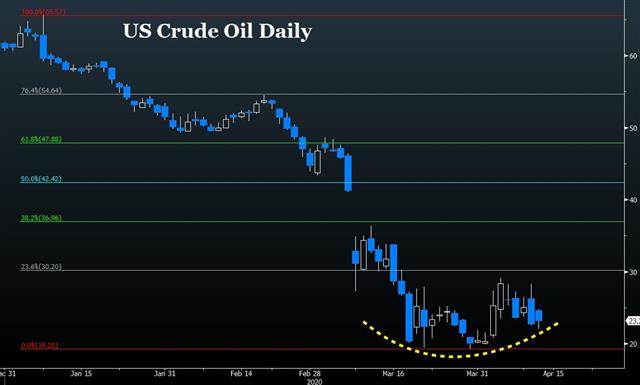
Oil extended its decline as markets returned from Easter Holiday, with US crude losing for the 3rd straight session to hit $20.30. Oil pushed higher early Sunday night, only to get slammed back down and then chop sideways to finish unchanged on Monday. But Tuesday proved a different story amid doubts with China's demand.
Virus news was largely more of the same but some talk of lifting some lockdown restrictions in May in the US and Europe was positive, though not really reflected in markets.
Today's rally in equities was led by consumer discretionary stocks and technology, with these two as the only losing sectors.
The notable directional move came in gold as it rose above the March highs to the best levels since 2012. The reality of central bank balance sheets and government deficits is dawning on the market and ETF flows show a steady bid in oil. Overlooked is that the worst-case virus scenarios have probably been avoided – things like government collapses and general panic. That diminishes the risk of liquidation of gold reserves, at least for now.
Technically, gold shows little major resistance until the all-time highs. Futures also continue to trade at a premium to spot in what's likely a sign that physical holders don't want to sell because of the difficulty in delivering right now.
Why Oil is Different
We've rarely seen so much confusion around an OPEC decision but much of it speaks to a misunderstand of how oil differs from so many other financial assets. Crude jumped 8% at the open only to give it all back. Watch out for spotty trading Monday as US re-opens, while most of EU remains shut for Easter Monday. There are currently 4 Premium trades open, all of which but one are currently in the green.

OPEC is an oil cartel but it's also a political organization and one that benefits from higher oil prices. Their spin about 20 mbpd of cuts is a fantasy. For one, it bends the baseline from February to April, where Saudi Arabia and others are pumping full-out. It also counts real and anticipated market-driven declines and hollow pledges. The reality is that OPEC+ is lowering production by 4.3 mbpd from Feb levels.
Naturally, this is helpful but crude is unlike almost every other market. Before the cut, oil was around 30 mbpd oversupplied and even if there was a 20 mbpd cut, it would still mean that 10 million barrels per day would need to go into storage.
Almost every other tradeable asset can be transported and stored relatively easily but crude can't. Oil above ground is a negative-yielding asset because it needs to be stored and transported. The entire midstream industry is built around doing that efficientl,y but everything has ground to a halt now.
In other assets classes, financial flows can disconnect prices for months or years – you can store money in any currency, bond or equity and many physical commodities can be easily stored. But crude ultimately needs to be bought by refiners or put into storage. There's some demand in spare storage now because you can buy in the spot market and sell into the futures market and guarantee gains but that window is narrowing.
In the real world, no one is driving and industry is crippled. Refineries are getting deliveries they don't want and undoubtedly cutting back on future orders as wholesale gasoline/diesel buyers stop buying from them. An OPEC cut simply isn't going to cause panic buying at refineries.
Also worrisome is speculators's tourism in the oil market. Obscure people we follow on twitter for oil news are suddenly celebrities. Technical news are getting hundreds of retweets. People are trying to crunch the supply numbers and are oblivious to the demand side, which is more opaque than any time in history. In normal times you can reasonably peg down the supply/demand balance within 500K bpd. Right now the spread – even among good analysts – is 20-40 mbpd.
Those flows are creating incredible short-term moves that makes any fundamental foray into oil treacherous. Squeezes can be limitless but ultimately, so long as supply exceeds demand, there's no floor in oil.
As for the broader market, look for signals from crude Monday with much of Europe and the world still out for holiday, the start of the week could be messy.


