Margin Debt Shows More Selling Ahead

by Ashraf Laidi
Oct 7, 2008 13:55 | 12 Comments

The considerable leverage accumulated during the last bull market is now forcefully being undone by a powerful combination of margin calls and accelerating market losses, triggering broad ripples of sell orders among large and small investors. On Jan 25th, 2 days after global markets plunged on the revelation of mounting losses at Societe Generale, we predicted a decline of 15%-25% in US equity indices for H1 2008 and further losses in H2. Amid the many signals in the market and the real economy, we focused on the aggregate margin debt used by member firms of the NY Stock Exchange.
Margin Debt Shows More Selling Ahead - Margdebtsep08 (Chart 1)


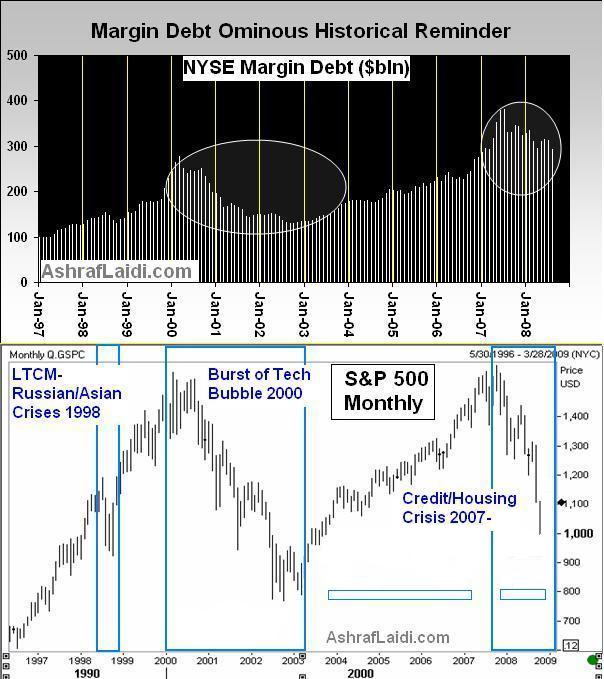
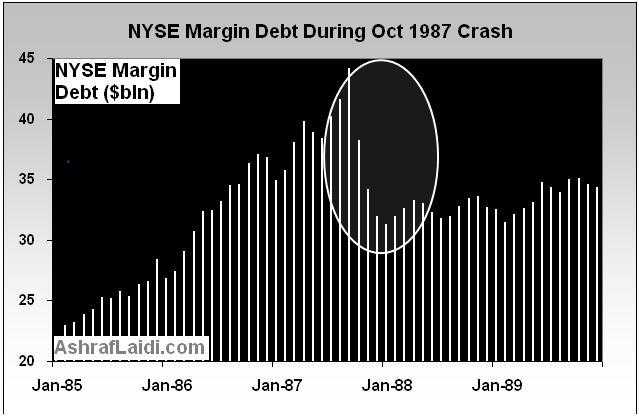
The chart shows that the rapid declines in margin debt from their record highs correctly predicted prolonged losses in the major equity indices in fall 1987, fall 1998 and spring 2000. After attaining a record high of $381 billion in July, NYSE member firms' margin use continued to tumble into the subsequent 4 months, reaching a low of $322 billion. The declines in margin debt resulted from the execution of margin calls as client losses escalate to unsustainable levels--a typical characteristic during surging volatility. The top chart also shows that after recovering in May-July near 300 billion, margin debt fell anew in August, reaching 292 billion--the lowest since March 2007. The bottom chart shows the monthly S&P500, and how it closely reflects the shifts in margin accumulation and disposal.

The relationship has already enabled us to predict 12-15% declines in equities in Q1 2008 (announced to clients in the 2008 preview in December 2007) and in H1 2008. Back then, the rationale was: "We expect another 15-25% of declines to come by end of H1 as the macroeconomic deterioration coupled with prolonged losses in US banks and profit warnings (no currency translation effect this time as the dollar stabilized in Q4-Q1) will overwhelm the easing measures of the Fed."
Margin Debt Shows More Selling Ahead - Margdebtoct87 (Chart 2)

Today, all major US equity indices are down by more than 30% year-to-date, leading their international counterparts well into bearish territory and ensuring that recession will not only meet its common definition of 2 consecutive quarterly declines, but also that the slowing economy will feed into weaker valuations and earnings compression. And as :place :country-region US stocks lose in 1 year what they gained in nearly 4 years, the corrosion to the wealth effect adds to an already fragile consumer foundation, burdened by negative home equities.

Margin debt accumulation and disposal bolstered our bearish take on the markets in January, allowing us to forecast renewed unwinding in yen carry trades. Looking ahead, we expect USDJPY to fall under the 100 yen level this month for the first time sine March. As long as the Federal Reserve holds out from cutting rates before October 29, markets are likely to maintain their relentless pressure, especially considering the vacuum of good news on the economic and earnings fronts. Additional deleveraging is also expected to weigh on EURUSD towards the $1.3350 territory, while dragging GBPUSD towards $1.7050.

Comments (Showing latest 10 of 12) View All Comments
Vee Han
Malaysia
Posted Anonymously
16 years ago
Oct 11, 2008 6:29
Excellent article! Helped me gain new insights to how margin debt affects stocks. I will be back to read more articles.
OldSouth
United States
Posted Anonymously
16 years ago
Oct 8, 2008 22:57
Thanks for the insights. I'm definitely not a pro in this world, but have felt for a long long time that the 'true' valuation of the Dow should sanely be about 7500, to give it some relationship to that nasty old-fashioned word 'earnings'.

I may have been optimistic...and see this as a long overdue (painful!) correction.

Good work, I'll be back to visit again.
Ashraf Laidi
London, UK
Posts: 0
16 years ago
Oct 8, 2008 15:56
The chart below the margin debt chart in my article clearly suggests 800 and 7000 are next in the S&P and Dow.
Brendan
Singapore, Singapore
Posted Anonymously
16 years ago
Oct 8, 2008 15:27
harmonycptl
CaliforniaCalifornia, California, United States
Posted Anonymously
16 years ago
Oct 8, 2008 13:59
Thanks again.

Jason
Ashraf Laidi
London, UK
Posts: 0
16 years ago
Oct 8, 2008 7:36
Jason, i mentioned in this latest piece that USDJPYto drop below 100 this month. It is already doing it. if they end upnot not cutting before Oct 29, we could see 95 before end of month. The central banks are out of amunition and so are the governments regardless of billions they spill on the problem. Rate cuts will only help ease the damage in the market but not get rid of it. we dont even know the magnitude of redemption notices by hedge fund clients, and further collapses of funds and so on... NIKKEI as we speak DROPS 9%, BIGGEST ONE DAY POINT DECLINE SINCE 1987.
harmonycptl
California, California, United States
Posted Anonymously
16 years ago
Oct 8, 2008 6:05
Ashraf,

Thanks - as usual your insight is appreciated!

If there is no pre meeting cut, where do you see teh USD/JPY bottoming?

Jason
Ashraf Laidi
London, UK
Posts: 0
16 years ago
Oct 8, 2008 3:22
Steve,

The UK govt package may prop cable to as high as $1.7650, 1.7750 but this will quickly be deflated by expectations of a rate cut on Thursday. NOW BE CAREFUL HERE: If they do 50 bps, we may see the same effect after the Aussie's 100 bp rate cut whose shortterm effect was AUD negative, but the positive impact on risk appetite and global stocks boosted high yielding currencies such as the Aussie vs JPY, USD etcc later in Asian and European session. 25-bp rate cut will be very negative for GBP. 50-bps on Thursday may have shortterm negative GBP impact, before a modest positive reaction. In summary, The ONLY WAY TO SEE GBPUSD CROSS ABOVE $1.78 IS DUE TO i) some really negative US-centric event such as a failure of a US bank ii) coordinated rate cuts by global central banks iii) or an intermerting Fed cut that not joined by ECB or BoE. My bias on Cable remains negative and any shortterm gains are a sell opportunity. Maintain LOW margin usage with cable.
Steve
New York, United States
Posted Anonymously
16 years ago
Oct 8, 2008 2:37
Ashraf,

This London bailout package tonite, will it explode gbp/usd? How high can gbp/usd go? One analyst says gbp/usd can dead-cat bounce to 1.7843-79 in coming days, weeks, is it possible, with rate cut decision coming Thursday morning 7 a.m.? Pls advise. Tks.
Ashraf Laidi
London, UK
Posts: 0
16 years ago
Oct 7, 2008 21:04
Jason,
Yes, partly yes. markets are pricing a Fed cut of 50 bps by Ooctober but they seem to be losing faith in an intermeeting cut or coordinated rate cuts, which if delivered, may produce a rally of no more than 2-3 days long. You and me have long discussed about the shortlived effect of those past interventions in AIG and Fannie/Freddie. When markets make their mind up about selling and the data picture us moving from bad to worse, very little can be done to stem the damage. In terms of time, it will take at least 18 months. In terms of magnitude, another 20-25% decline, as these charts indicate.

Nick,
The market declines may take another 18 months in the form of consolidation, false rebounds in the magnitude of about 7%-10%. Look at the S&P monthly chart above had several false recoveries in 2001 and 2002. As for the dollar, we could see 1.3350 in EURUSD, $1.7050s in cable, but 97-99 in USDJPY. EURUSD bottom unlikely to be finally reached until Q1 2009.