Intraday Market Thoughts Archives
Displaying results for week of Jan 05, 2020نراكم في مؤتمر دبي بعد أسبوعين
يسعدني المشاركة في مؤتمر دبي للأسواق ٢٠٢٠ خلال أسبوعين من الآن في فندق الفور سيسونز جميرا. للتفاصيل و المشاركة
Inflated Risks in Employment Reports
The anticipation for Friday's non-farm payrolls is low but that doesn't mean there are no risks. Closely watch the US earnings y/y figure (wages). More details on earnings (wages) are below. The Swiss franc was the top performer on Thursday while the New Zealand dollar lagged. And don't forget the always volatile Canadian jobs reports.
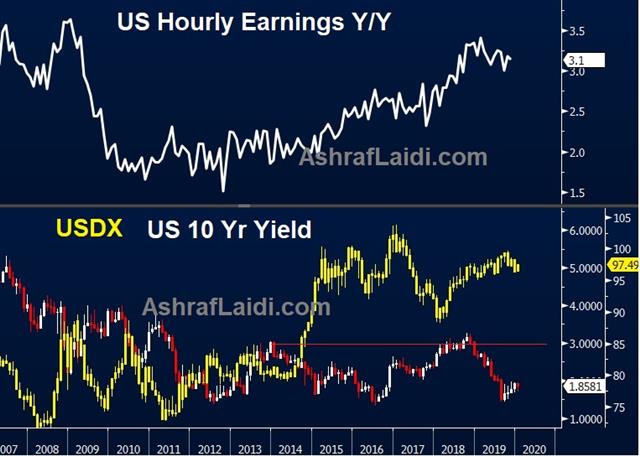
The consensus for the non-farm payrolls report is +160K after a sizzling +266K reading in November. Even a very soft number would be shrugged off by the market as a give-back from the prior month, but there are risks on the upside. The Fed funds market continues to lean towards a rate cut in 2020 with an 79% chance priced in by year-end. A hot report could start some second guess.
In particular, wage growth is a spot to watch. The consensus is for a 3.1% y/y reading and 0.3% m/m. Those aren't alarming numbers, but the last six months, the rate has run at nearly 4%. Starting in January, some strong y/y comps roll off and there is a growing risk of numbers in the high 3%s.
That isn't likely to sway Powell, who said he wants to see persistently above-target inflation before changing his stance, but Fed hawks may be less-comfortable with that idea, especially if other economic indicators pick up.
Also note that the US employment report isn't the only one on the agenda. The volatile Canadian employment numbers are due at the same time. The consensus for December is +25K as economists lean higher from the +10K they usually pencil in. They are anticipating a bounce back from a -71.2K reading in November that was impacted by strikes and plant shutdowns.
The Canadian dollar has been choppy in recent weeks as it's pulled around by the oil and risk trade. That's left an uneven footing in the market and means that any miss could have an outsized impact on the currency.
Oil Trading Misconceptions
“There is a war, let's buy oil” seems to be an oft-repeated phrase these days. Instead of arguing whether war will break out in the Middle East, it's more important to remind that any oil rise from recent MidEast Wars did not last much. A new Premium video below has been issued to our Premium subscribers, further detailing the rationale of last night's trade, which is deepening in the money as we speak.
Starting with Saddam Hussein's invasion of Kuwait in early August 1990, US crude oil doubled from $20 to $40 per barrel after Kuwaiti pipelines were set in flames. Oil peaked 2 months later at $41, before descending on downward spiral ahead (and after) the US-allies' declaration of war over Iraq in January 1991. What about the US invasion of Iraq in March 2003? Oil began rising in the preceding three months as the US fabricated the case for invading Saddam Hussein—from $26.50 in December 2002 to $40 in February of 2003. Oil fell in the subsequent three months back to mid 20s.
Some might say: “But oil rose throughout the rest of 2003 and 2004 !”. Yes, and so did every other commodity and currency against the US dollar, as the US dollar bear market intensified on a combination of escalating twin US deficits and Fed rate cuts. Also, don't forget china headed off an infrasctrure building boom, sending every commodity higher.
What about now? In an age of excess oil supply courtesy of debt-ridden frackers, and dubious oil demand from a mixed global economy, would you buy every oil jump? Or would you wait for US crude to reach $55 and buy there based on your expectations of resurfacing MidEast action? All of this is covered in our Premium video (along with oil dynamics relative to oil and indices) as well as an actionable trade idea.
الانحدار الخطي والانحراف المعياري في الداو جونز
يقدم لكم خبير الأسواق العالمية أشرف العايدي فيديو تفصيلي عن كيفية تطبيق الانحدار الخطي على المؤشرات الأمريكية، ومدى الانحراف الذي وصل إليه الداو جونز! التفاصيل في هذا الفيديو الحصري
Real News, Fake Breakouts
An apparent de-escalation in the US-Iran conflict led to massive reversals in gold, oil and risk trades on Wednesday but that's unlikely to be the final chapter in this story. The kiwi was the top performer and yen lagged in a volatile day of trading. Expect geopolitics to continue to dominate in the days ahead. Tuesday's Premium short in the DOW30 hit it its final target of 28150 for a 470-pip gain. A new trade was issued on Wednesday evening (neither in FX nor indices).
حان وقت صفقة أنتظرناها اكثر من 3 أشهر (فيديو للمشتركين)
On Tuesday, gold rose to the highest since 2013 and WTI oil spiked to $65 but both later reversed to finish much lower. The high-to-low swing in oil was nearly 10%. Equity markets also swung towards solid gains from deep loses.
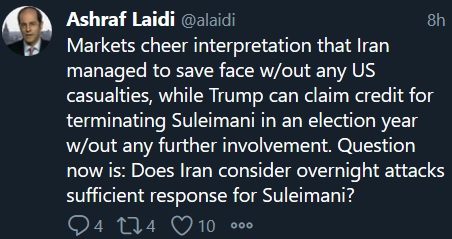
The market thinking now is that both sides have flexed their muscles, while seeking to avoid war. However that true that maybe at the highest levels, there are hawks on both sides pushing for further action. On the US side that impulse can be restrained by Trump but he's notoriously moody and impulsive so risks remain high. On Iran's side, leadership has less control over militias and proxies who could act independently.
Along those lines, late on Wednesday a pair of rockets were fired towards the US embassy in Baghdad. So while top leadership in Iran may want to avoid war, there are some who pine for it. Even if a group unaffiliated with Iran strikes the US, the blame (and retaliation) may fall on Tehran.
In terms of trading around geopolitics; it remains a minefield. Unlike the worst of Trump's tweets on the US-China trade war, where selloffs were pronounced in indices, yields and gold, a real war in the Middle East has significant weight on each of those markets in addition to oil mand the yen. The fog of war has descended on news surrounding Iran. There have been multiple rumors and fake reports of attacks in the past week including one shortly before the real attack. So when the real news began to trickle in, markets were initially skeptical.
A continual risk will be rumors and fake reports about further attacks. That backdrop will make it challenging to stay in risk trades and that strongly argues for stops, managing risk and staying nimble.
Onto ISM Services & the Right Shoulder
Ashraf suggested adding the 2nd part to the title as a clue to his latest trade. Risk trades shook off Iran worries in a turnaround on Monday but are gradually returning today. Mixed messages on to whether the US is withdrawing its bases from the MidEast were corrected by the Pentagon, indicating no withdrawal. Indices VIX returns above 14, gold regains 1570, while oil pulls back below 63. The crcuial US ISM non-manufacturing survey is due up next. A new Premium trade was posted and sent with 3 new charts.
Fading geopolitical fears is one of the all-time great trades but the timing is always elusive. There is no pricing mechanism for geopolitical risk and there is rarely a signal for peace and stability. Instead it's time that generally heals geopolitical wounds. It takes a steady stream of escalating headlines to sustain a risk-off tone, while it only takes quiet to reverse it.
That was the case on Monday in a 32- point turnaround in the S&P 500 from a solid decline to a 0.35% rise. The FX turnaround wasn't nearly as uniform but the yen softened and gold pared half of its gains. After rising to $70.74, Brent crude fell back to $68.54.
At this point in the cycle, economic data works in the opposite way to geopolitical fear. The data need to be routinely strong or improving to sustain some of the levels in risk trades. The Caixin China services PMI underscored some of the fears on Monday in a slip to 52.5 from 53.5. The worry is that manufacturing weakness is spilling over into the service sector.
In the US, there are few worries about services but that could quickly change if we get a miss in the ISM survey. The consensus for the non-manufacturing index is an improvement to 54.5 from 53.9. That will be released at 1500 GMT on Tuesday alongside the factory orders report, which are forecast to fall 0.7%.
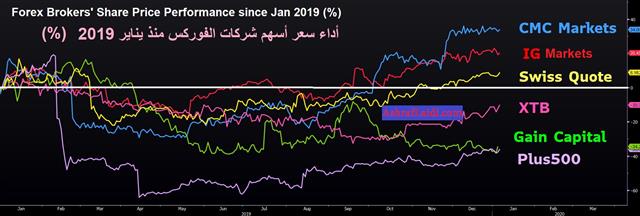
Forex Brokers' Share Price Performance
The share price of publicly traded forex brokers has behaved rather differently since 2018 and 2019. Here is the full story below.
MidEast Tests Risk Appetite Foundation
Markets absorb earlier earlier losses from the escalation of MidEast clashes. Iran said it will no longer observe limits on uranium enrichment and Iraq signaled it will expel foreign military forces as the fallout from the Soleimani assassination threatens to further roil markets. JPY is the biggest loser, lifting USDJPY to 108.30s from 107.70s, while GBP is the biggest gainer, following UK services PMI's return to the 50 level. US services PMI edged higher, with all eyes on the services ISM tomorrow. Don't forget US and Canada jobs this Friday.
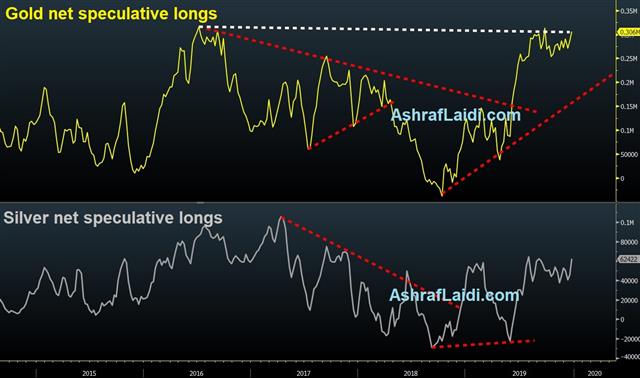
The Iran-US confrontation is in a deep state of flux, and is increasingly likely to show further reverberations. Iraqi parliament on Sunday voted on a resolution demanding foreign troops to leave the country immediately.
In the holy city of Qom a red flag was unfurled on the Great mosque of Jamkaran in a signal of extreme alertness, but it's not clear if that's an offensive or defensive gesture. Trump warned that the US had identified 52 Iranian targets if Iran launches an attack on US forces.
At presentm it appears like a retaliation from Iran is imminent, but last year's attack on Saudi oil refinery is instructive. There remains little appetite for war, and US forces wildly exceed any others in the region. Tensions can dissipate quickly.


