Sterling Opportunism Proves Limited

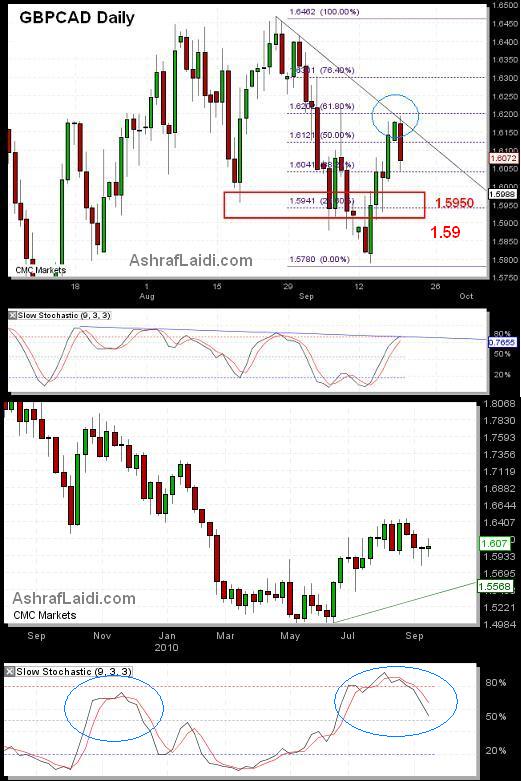
Sterlings recent advances vs. USD had been primarily a case of USD-weakness than any warranted strength from the UK. Todays UK mortgage approvals data showing a 17-month low in August follow last weeks 24-point decline in the August RICS house price index, which was a 9-month low. While GBPUSD faces downside risks towards $1.5480s on the data, especially following the failure of $1.57, there remain the medium term risks of QE2 from the Fed, countering any advances in USD. GBPCAD shorts have more fundamental backing ad the loonie remains propped by constant upside surprise in jobs (renewed creation of net employment after only 1 month of losses this year) and business surveys (August Ivey PMI survey highest since June 2008). We still side with the notion that any QE by the Fed will likely trigger similar easing from the Bank of England. Despite the fact that inflation continues to linger above the BoEs 2.0% target, the 3.1% August reading is an improvement from the 22-month highs of 3.7% attained in April. The GBPCAD CHART shows a failure at the 1.6200, which marks i) double top (Sep 8 & 20); ii) trendline resistance from Aug 26 and; iii) 61.8% retracement of the decline from the Aug 26 high to the Sep 14 low. The weekly chart illustrates a clear case of negative stochastics, whose longer-term outlook suggests a preliminary downside target of 1.5780. A CLOSE above 1.6220 would bring an end fo the short call.
More Hot-Charts
-
DXY and Cable
Jul 24, 2025 14:20 | by Ashraf Laidiسأرسل رسالة صوتية و كتابية توضيحية لأعضاء مجموعة الواتساب الخاصة حول هذه المخططات - Will send a detailed note on the latest technical parameters to our WhatsApp Bdcst Group... -
Gold New Range
Jul 10, 2025 12:10 | by Ashraf Laidiسأرسل رسالة صوتية و كتابية توضيحية لأعضاء مجموعة الواتساب الخاصة حول هذه المخططات - Will send a detailed note on the latest technical parameters to our WhatsApp Bdcst Group .. -
Gold 30 mins
Jun 25, 2025 12:12 | by Ashraf Laidiسأرسل رسالة صوتية و كتابية توضيحية لأعضاء مجموعة الواتساب الخاصة حول هذه المخططات - Will send a detailed note on the latest technical parameters to our WhatsApp Bdcst Group...


Ashraf
Thanks Ashraf
b.