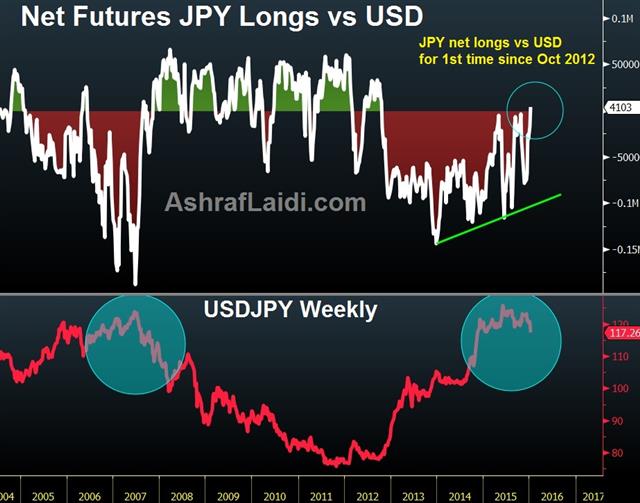
JPY net LONGS for 1st time since Oct 2012
And for the first time since October 2012, futures speculators become net LONG Japanese yen vs US dollar.
PM Abe's four arrows and the BoJ's heavy stacked QE made the yen the preferred shorting currency for more than 3 years. The corresponding USDJPY chart highlights the potential double top since the 2007 peak, which was followed by the yen's surge during the crisis. Since October, we warned our subscribers to not expect any more QE from the BoJ in November, December or Q1 2016 for the simple reason that there not enough JGBs to buy. Pulling a Japanese version of operation twist won't do. Going the route of equity ETFs might temporary prop the Nikkei and Topix, but won't pressure the yen.
Japan's Government Pension Investment Fund is done with its bonds-to-equities shift. By the time global risk aversion and a US recession occurs in late Q2 2016 (likely to be found in the US Bureau of Economic Analysis of in Q3 2016), USDJPY would have reached 109.00.

More Hot-Charts
-

Gold Channel ABC and D
Jan 8, 2026 16:27 | by Ashraf Laidiسأرسل رسالة صوتية و كتابية توضيحية لأعضاء مجموعة الواتساب الخاصة حول هذه المخططات - Will send detailed note on latest parameters to our WhatsApp Bdcst Group - -... -

EURUSD Next
Jan 5, 2026 17:09 | by Ashraf LaidiIf EURUSD holds Monday above 1.17, it will show a hammer candle, supported above the 100-day moving average. -
Gold Next Move
Dec 26, 2025 15:32 | by Ashraf LaidiWill send detailed note on latest parameters to our WhatsApp Bdcst Group - سأرسل رسالة صوتية و كتابية توضيحية لأعضاء مجموعة الواتساب الخاصة حول هذه المخططات - ..


