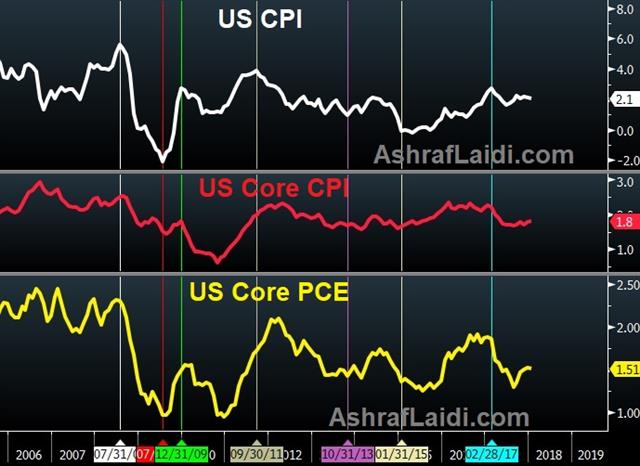
CPI or PCE?
Non-farm payrolls gave a lift to risk assets on Friday another strong jobs number came with moderating wages. Early moves in the new week have been modest. CFTC positioning data generally showed a shift towards neutral. Ahead of Tuesday's release of US CPI, Ashraf posted a chart below, highlighting the course of US CPI, core CPI and the core PCE (Fed's inflation gauge). Which one leads the other? The answer is clear with the help of a few vertical lines. There are currently 11 Premium trades in progress; 7 in the green, 2 even and 2 in the red.

Non-farm payrolls rose 313K compared 205K expected in another sign of solid economic growth in the United States. A month ago, that was accompanied by a rise in wages that contributed to a wave of volatility throughout markets. This time, wages rose 0.1% m/m compared to +0.2% expected and 2.6% y/y versus the 2.8% consensus. More on the jobs/earnings report here.
The reaction was a jump in the S&P 500 climbing 1.7% and AUD/JPY positing its best day since July. It was the classic risk-on response and it hints that growth can continue to improve and the Fed doesn't need to quicken the gradual pace of rate hikes.
The response underscores how dominant the inflation theme is for markets right now. At the same time, geopolitics remains a constant risk as North Korea and the circus in the White House continues.
CFTC Commitments of Traders
Speculative net futures trader positions as of the close on Tuesday. Net short denoted by - long by +.EUR +133K vs +138K prior GBP +5K vs +13K prior JPY -87K vs -97K prior CAD +20K vs +22K prior CHF -8K vs -16K prior AUD +3K vs +10K prior NZD +0.5K vs -1K prior
Swiss franc and yen shorts picked a bad time to throw in the towel – they were the two worst performers last week. In general, the shifts were modest.
Latest IMTs
-
2x our Gains in 8 Weeks
by Ashraf Laidi | Feb 3, 2026 10:28
-
4500 and 72 Hit, now what?
by Ashraf Laidi | Feb 2, 2026 2:22
-
Warsh Odds Hit Metals
by Ashraf Laidi | Jan 30, 2026 10:56
-
Time Stamp تجزيء زمني للفيديو
by Ashraf Laidi | Jan 29, 2026 9:09
-
Trump Hits Dollar but Wait Bessent & Powell...
by Ashraf Laidi | Jan 28, 2026 11:47


