Intraday Market Thoughts
Scary Mystery Chart
by
Apr 19, 2017 12:54
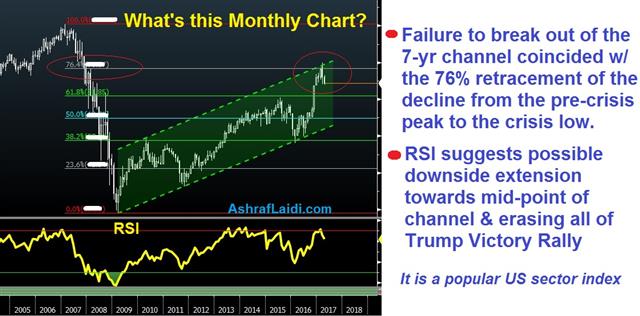
Care to guess this chart? It's the monthly chart of a popular US sector index. As you can see, it failed to break its 7-year channel right at the same level of the 76.4% retracement of the decline from the 2007 high to the 2009 low. The relative strength index may also indicate further declines towards the mid-point of the channel's height, a break of which may drag it to pre-November levels. i.e. erasing the all of the gains from the Trump's victory rally. Again, this is not FX, commodity, bonds or a ratio. Just a straightforward index. It's a big deal when you find out what is.
Click To Enlarge

Latest IMTs
-
Gold Enters Week 9
by Ashraf Laidi | Oct 13, 2025 10:39
-
Gold Wave 3 تحديث موجات الذهب
by Ashraf Laidi | Sep 18, 2025 16:19
-
Forecaster App التطبيق الذي كنت تنتظره
by Ashraf Laidi | Jun 18, 2025 10:55
-
Updating GoldBugs تحديث مناجم الذهب
by Ashraf Laidi | Jun 16, 2025 13:58
-
Breaking Debt Ceiling & Forex Brokers
by Ashraf Laidi | Jun 6, 2025 17:33


