



Trend vs Trendline: Gold, DXY, Yields
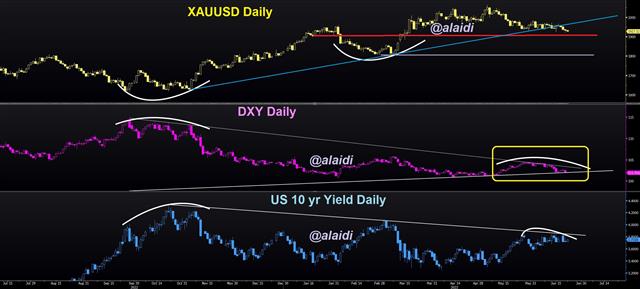
The chart below highlights the generally sensible relationship between rising trendline in gold and falling trendline in USD Index as well as US yields. “Ashraf, did you say rising trendline in gold?? Ive been long gold and lost money”. Yes so am I and so have I. Short-term traders long gold are suffering the 5% decline in bullion from start of the year, as well as the intensifying selloff of the past 4 days. -5% YTD is bad, while -7% from the year highs is worse. The opposite holds true for 10-yr yields, which have jumped 16% from their March lows, but are 1% down YTD. Gold traders have their eyes fixated on the 3.83/4% level, which is not only the year's open but also the top of the trendline resistance. Any print above 3.90% would trigger an ugly cascade of sell orders across metals and indices (especially Tech).
How is this all relevant to those with longs in metals? Gold can remain in its own (primary) uptrend as long as it holds 1810/20. This requires support from silver upholding 21.80/90 and copper doing the same at 7880. Our intermetals frameworks also examines platinum and real yields. While this can be a dangerous example of shifting the goal posts and redefining boundaries, it remain consistent with capturing the general trend, which is what classic technical analysis is about.
For a recent real-life example of this approach, take a look at how Gold's triple bottom from last autumn finally stabilized well after silver, platinum and copper did the same. Ive mentioned this repeatedly in my recent seminars/webinars and made a it a constant reminder to our WhatsApp Broadcast Group.
Latest IMTs
-
Win a Free Membership
by Ashraf Laidi | Sep 18, 2026 16:42
-
Win a Free Membership
by Ashraf Laidi | Sep 18, 2026 16:42
-
Gold Fears Japan Hike
by Ashraf Laidi | Sep 17, 2026 12:15
-
I will go Live بث مباشر
by Ashraf Laidi | Sep 16, 2026 11:26
-
ندوتي مساء الثلاثاء
by Ashraf Laidi | Sep 14, 2026 12:09