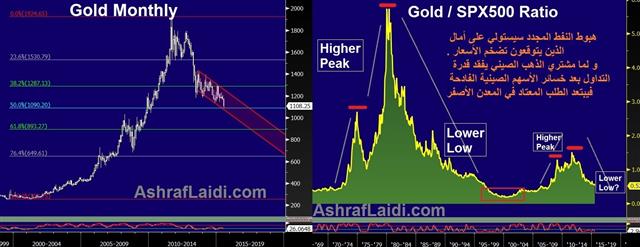
Gold/SPX Ratio's Boom-Bust Pattern
Gold's tumble to a 5-year low today is the latest manifestation of the ensuing crash in global commodities. The reasons are not new: The recent 20% decline in oil will turn an already low-inflation environment into potential disinflation. The Fed's signalling of higher interest rates as early as this year plays up yielding assets against the non-yielding metal. Chinese investors are busy dealing with massive losses in stocks, unable to mount their usual buying of gold dips.
Technically, today's gold low coincided with $1,086, which is the 50% retracement of the rise from the 1999 lows to the 2011 highs. Gold's 12-year run was based on a recovering world economy, brought about by broadening demand for agricultural, metal and energy commodities and accelerated by a falling US dollar as the US twin deficits hit record highs.
Repeating Boom-bust Gold-Stocks Cycle
Comparing gold to equities, the gold/SP500 ratio has fallen 65% from its 2011 highs to reach an 8-year low. So far the pattern appears similar to the boom-bust cycle in the Gold/Stocks ratio of 1974-1980s, when the inflation-driven supercycle in commodities propelled metals to 30-year highs relative to stocks, followed by a 2-year dip in the mid-1970s, only to rally again on soaring inflation and geopolitical shocks (Soviet-Afghan war) and Iran Revolution.
Eventually, gold's damage from the late 1980s into the 1990s sent the gold/stocks ratio to new lows.
If the $1,080 gives way to technical selling, then prolonged downside calls up $1,030, followed by $920. But can the Fed still raise rates if returning disinflation becomes deflation?


