Winners & Losers
Here is how we made money from the 60% rise in Copper (from $5K to $13K per tonne). We first informed our WhatsApp Broadcast Group about Teck Resources and Southern Copper back in March 2021. I bought Teck Resources in June 2024, reinformed the Group about it in June 2024 and again new members in September 2025. Today, Teck is in merger talks with Anglo American to form a copper powerhouse. Southern Copper has gone from $76 in April to $184 today. We do not ONLY talk about metals, currencies and indices in the Group, but also inform members on my stocks purchases and adjustments. Our other successfull stock trades were (still holding them) Taiwan Semiconductors, D-Wave, BridgeBio, RobinHood, Palantir, Cameco and Reddit. The bad trades of 2024 were MSTR and NVO--Also still holding them.

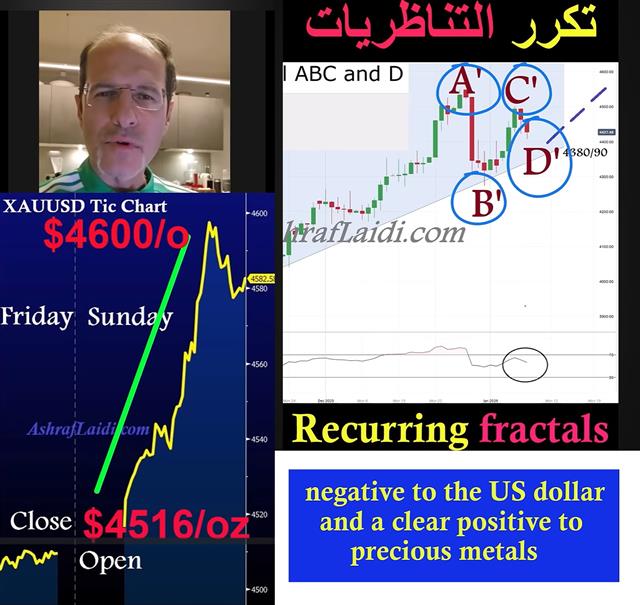
Update on Gold & Silver after USSC
I said in yesterday's newsletter that another delay by the Supreme Court on tariffs may be negative for stocks. But if the USSC continues to delay the ruling, it may mean either of two things: 1) they need more time to draft their finding and issue a ruling, which raises the chanes of ruling against the tariffs; 2) they continue to delay until the issue leaves market attention. Either way, gold remains boosted and silver will break above $100 video here.
Gold Channel Intact
Find out how the gold channel remains intact, paving the way for at least $95 oz in silver. See video here.
Why I Bought Gold & Silver
Here is a Live I posted 15 mins after the US jobs report, explaining why I bought gold and silver 20 mins before the report. The Live is mostly in Arabic, but there is sufficient English to explain the mechanics of the trade. I also discuss oil, USD and the euro. View the Trade here
Beware of US Supreme Court Ruling on Tariffs
🚨 Friday's ruling by the Supreme Court on the legality of US tariffs could have a sharp but short-lived impact on stocks, bonds and even gold. I've read several simplified scenario analysis to the consequences of the ruling, but if you're day trading then you must be aware of the legal nuances the Trump administration can adopt. A ruling against the tariffs likely boost stocks by removing the burden on companies to "eat" the tariffs or to "absorb" any increase to the retail price. Consumers stocks will also likely gain. But there are other points worth noting. See below the image for more details.

✅ Stocks of companies largely dependent on imported goods may benefit from a ruling against the tariffs.
✅ US govt bond prices may decline (yields rise) because any tariffs removal is considered stimulatory to consumers and the economy. This may weaken the case for Fed rate cuts, while exacerbating the Federal deficit via restricting tariffs revenues.
✅ A rise in bond yields may cause a sharp but shortlived decline in gold.
🚨 If the Supreme Court rules against the legality of the tariffs, the ruling could be neutralised by the Trump Administration under Section 232 of the Trade Expansion Act of 1962 and other articles granting the US President the authority to impose taxes and duties.
Imagine the market's reaction to the initial ruling and to the follow-up reply from the Oval Office. Do you really think the ruling will take part during market hours?
Careful.
Archives


