Implications of Gold's Rise Relative to Oil

by Ashraf Laidi
Sep 18, 2008 19:12 | 23 Comments

In the September issue of Futures I predicted that the gold/oil ratio would continue to recover from its July record lows as oil begins to underperform gold. The latter would recover as the dollar drops on deteriorating macroeconomic fundamentals and further erosion in financial markets, all triggering re-emerging expectations of Fed cuts.

Ever since the gold-oil ratio bottomed to a record low of 5.8 in July-courtesy of soaring oil prices relative to gold, the rebound was inevitable, especially as the ratio was well below its 37-year monthly average of 13.0 (see dotted horizontal line).

The latest jump in gold oil prices to a 5-week high of $895 per ounce and the simultaneous dip in oil prices below $92 per barrel is consistent with the aforementioned analysis. The chart below shows each time the gold/oil ratio had bottomed, a rebound was accompanied with a US recession, Fed easing and dollar weakness (accompanied by rising gold). In fact, since 1972, each of the last five U.S. recessions was preceded by 20-30% declines in the gold-oil ratio from its most recent highs.

RATIONALE
During economic expansions, rising demand for industrial metals and energy boosts both oil and gold prices, thus leading to a rising or steady gold-oil ratio. But when substantial advances in oil are the result of supply factors (political risk, wars, acts of god, labor union action, OPEC action/rhetoric, refinery shutdowns and falling inventories), oil prices tend to overshoot, clearly outpacing any gains in gold in relative terms, producing cost and inflationary repercussions for importers and consumers.

The chart shows how bottoms in the gold/oil ratio (shaded areas) were followed by declining or contracting GDP growth. In each of those cases, the Fed was obliged to cut rates and the dollar sustained fresh damage.
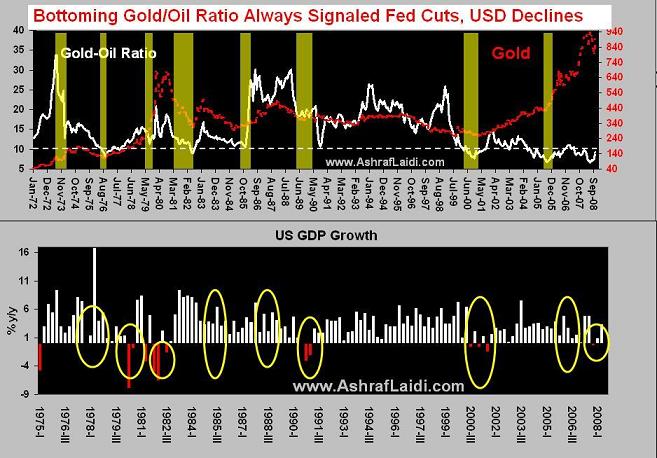
Implications of Gold's Rise Relative to Oil - Goldoilsep08 (Chart 1)


1973-75 Recession

1974 quadrupling of oil prices triggered sharp run-ups in US gasoline prices and a subsequent halt in consumer demand. Resulting USD drop pushed gold up by 15%. But faster oil appreciation dragged down gold-oil ratio from a high of 34.0 in July 1973 to 23.2 in October of the same year, before extending its fall to12.2 in January 1974. By 1974-75, the U.S. and the major industrialized economies had fallen into recession.

1980-82 Recession

Tumbling dollar and record oil main culprits to the 1980-82 recession. Gold-oil ratio dropped from 15.3 in January 1979 to 11.4 in August 1979 due to a doubling in oil to $29 and a more modest 30% increase in gold.

The 1977-79 dollar crisis forced OPEC to further hike prices to offset FX value of oil revenues. Iran revolution endangered oil supplies, thus ensued a 200% increase in oil between 1979 and 1980, giving rise to the second oil shock within less than 10 years.

The Gold-oil ratio fell anew from early 1981 to mid 1982 as oil remained around the mid $30s while gold plummeted from the $830s territory to $400 on waning impact of Soviet-Afghan. In summer 1981, the gold-oil ratio dipped to a 4-year low of 11.4 amid plummeting gold and stable oil, then onto 9.0 in Summer 1982, in line with the deepening 1981 recession which extended into mid 1982.

1985- 86 Slowdown

In autumn 1985, the gold-oil ratio bottomed at 10.6 from its 16.9 high in February 1983 due to relative stability in gold & oil. 35% decline in gold-oil ratio proved successful in signaling the 1985-1986 slowdown and resulting Fed rate cuts in February-July 1986.

Unlike in prior cases of falling gold-oil ratios, GDP growth avoided a contraction partly due to the offsetting positive effects of 1986 oil price collapse following OPECs flooding of oil.

MORE DETAIL ON HOW THE GOLD/OIL RATIO IS USED CAN BE FOUND IN CHAPTERS 6 AND 9 OF MY UPCOMING BOOK.

Comments (Showing latest 10 of 23) View All Comments
Ashraf Laidi
London, UK
Posts: 0
16 years ago
Oct 9, 2008 1:18
http://blogs.wsj.com/marketbeat/2008/10/08/gold-vs-oil/
Roberto
UK
Posted Anonymously
16 years ago
Sep 26, 2008 19:51
http://biz.yahoo.com/ap/080926/mint_gold_coins.html
US Mint halts sale of gold coins due to soaring demand
harmonycptl
California, United States
Posted Anonymously
16 years ago
Sep 23, 2008 6:26
The CAD/JAP Monthly is extremely topish as well.

I might go long on a very small lot with tight stops. If the 107.3 mark can be broken there is no resistance to 122 which would form a classic double top.

Still placing main focus on GBP/USD ready to short - hard resistance is being encountered at 1.863/64 range possible reversal beginning with shooting star formation on 240 minute chart
Ashraf Laidi
London, UK
Posts: 0
16 years ago
Sep 23, 2008 6:03
Jason,

Regarding your wanting to long CADJPY based on further gains in oil, I would not jump on this trade due to the increased possibility of a BANK OF CANADA RATE CUT at the October 21 meeting. With the US economy increasingly strained, North of the Border is struggling across the board with the exception of oil driven Alberta. Yes, they did have a few stronger than expected job reports, but combining risk aversion, yen strength and US weakness, CAD may be in for some hard times.

WEELY CADJPY CHART looks technically toppish, with gains limited at 103, but ample downside room towards 100 and 99.30.

WILLIAMS % R looks BEARISH both in Daily and Weekly.
harmonycptl
United States
Posted Anonymously
16 years ago
Sep 22, 2008 23:06
Steve, Ashraf

Have you recently traded the CAD/JPYcross? It is currently in consolidation of recent bullish trend and at the low range of yesterdays highs. Also sensitive to the volatility of Oil.

Thinking of going long if there is a dip to 101.60 - 101.70 range.
harmonycptl
California, United States
Posted Anonymously
16 years ago
Sep 22, 2008 22:56
To All:

Any effect on the GBP from rising Oil?
Nat Gas is still relatively unchanged vs. Oil and GBP is a high prodcer of Oil, and Cosumer of Nat Gas.

Also, will the U.S political climate further drag on the Dollar - Taliban/Pakistani Army Terror upswing in Pakistan, Electoral discomfort and Lame Duck CEO at Home?

240 Minute Chart shows potential Evening Star - Tweezer top foming at new highs, potential reversal formaing.
Ashraf Laidi
London, UK
Posts: 0
16 years ago
Sep 22, 2008 22:27
Steve, Jason,

I agree with Steve about GBPUSD being a great sell at $1.86 and remains so until $1.8480s. We will get the CIPS surve from the UK this week, and these may prove GBP negative. AUD longs may also be looking at 87 cent as a medium target. Yes, USD is deeply negative, but it is the least negative against GBP.

Alternatively, GBPAUD and GBPJPY may be good shorts too.
harmonycptl
United States
Posted Anonymously
16 years ago
Sep 22, 2008 22:09
Steve:

Fundamentals are still suporting a bullish sentiment on GBP/USD: Carry and Bond trades, combined with expectations of Fed easing and possible commidity inflationary pressures.

The Fed and Treasurey is basically caught in a vice between maintaining capital inflows (Treasury sales pricing) and maintaining credit markets through easing.
Foreign investment is viewing US Treasuries as relatively more risky leading to demand for better pricing on Yields. At the same time LIBOR rates are climbing, inducing credit disruption in the commercial markets.

Technicals show that GBP/USD could reach as high as 1.87 (2 day old highs), before Bear correction, a break below 1.84 would indicate possible shifting sentiment. However sentiment is very Bearish on the USD so caution is advised.Given the record incease in WTI today, I think that Ashraf's advice on Gold is sound.
Steve
New York, United States
Posted Anonymously
16 years ago
Sep 22, 2008 20:57
Time to short GBP/USD? Too high now 1.8614 at 4 p.m. Any thoughts?
Steve
New York, United States
Posted Anonymously
16 years ago
Sep 22, 2008 20:27
To all:

USD/JPY should go down to target 104.45. Happy trading.

GLD - Gold ETF up target $100 coming period.