Yield Curves, FX & LIBOR Trends
While FX trading seems to become increasingly bifurcated (broad USD weakness & broad JPY strength or vice versa), the unfolding trend remains a concerted move away from the QE currencies (USD, GBP) and into the commodity/high yielders as well as the EUR. Emerging talk on whether the US dollar has become the new low-yielding vehicle for carry trades financing equities, commodities and currencies vehicle highlights the difference between the USD and JPY carry trades. The latter was driven by structurally low Japanese rates (sub 1.0% since for past 10 years), which were a reflection of Japans anti-deflation policy, its current account surplus and the resulting proclivity to save.
But with the US budget deficit outpacing the level of that twice the total of the twin deficits (trade and budget) prevailing in 2004 (now at nearly 10% of GDP), there emerges the risk of renewed steeping in the US yield curve (widening spread between long and short term rates) as short term rates are dragged down by falling US LIBOR rates and long term yields chase escalating govt debt (which remains on the rise despite slowing private sector and household debt).
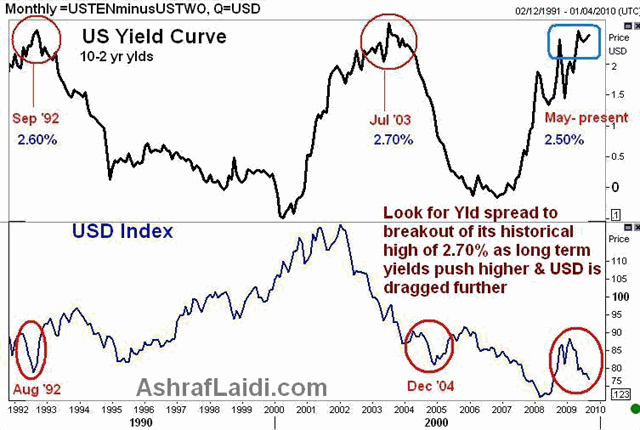
Yield Curve Steepening and Dollar Flattening
The chart below shows the US yield curve (as measured by the 10-2 spread) has peaked out at 2.60-2.70% in each of the last easing cycles (1991 & 2001 recessions). Thus, each time the 10-2 spread neared 2.70%, the FOMC was at the end of its easing cycle. This time, the two main forces that could help the current steeping exceed the highs of 1992 and 2003 are soaring US govt debt and secular decline in the US dollar. From a debt standpoint, despite evidence of household deleveraging in Q2, Federal debt issuance shows no sign of abating, especially when seen through the treasury auctions, which continue to reach new record issuance every month. From an FX standpoint, the dollar's heightened vulnerability emerges from its low yield and recurring role as a funding vehicle for the global recovery (or stability) play. Such vulnerability will remain despite the USD's preservation of its role as a reserve currency. Meanwhile, we see no change in the notion that rising risk aversion is the only viable source of any durable dollar rebound.
For more analysis on how to use the US yield curve in gauging moves in USDJPY and Fed tightening, see chapters 6 and 9 of my book
The Fed could hope to alleviate the steepening yield curve by renewing its program of asset purchases (not an option from an exit strategy-minded central bank). But any sign of extending the asset-purchase program would entail an extension of QE and a green light for traders to send the currency into danger territory. Opting between fast USD selling and excessive yield run-up is one of the Fed's many dilemmas. Such vicious circle remains the principal driver for hedge funds and other central banks to accelerate their build up of precious metals, which bolster the case for $1,200 per ounce in gold before year-end.
Oversold vs. Undervalued
The USD may be oversold in terms of excessive optimism in equities, USD shorts in futures markets and the excessive ascent in other currencies whose economies remain in or close to QE, but not necessarily undervalued as soaring debt deficit nears 10% of GDP as well as the fact that US growth remains negative (disproving the FIFO hypothesis that US would enter and exit recession before the rest of the world). With Germany, Norway, Australia, S.Korea, Hong Kong and New Zealand each back into positive GDPO growth), such broad evidence of economic stabilization outside the US offers tremendous justification for asset managers to take diversify their stock selection out of the US.
2005 and 2008
Some historical perspective also helps. Ever since the dollar bear market began in Q1 2002, the US currency has had 2 legitimate recoveries; the 2005 rebound, which largely resulted from the temporary tax holiday (Homeland Investment Act) designed to incentives US multinationals to repatriate earnings; and the 2008 rebound driven by the stampeding out of commodity and emerging market plays into safer USD-denominated cash. The 2005 rebound was also associated with the Federal Reserve being the first major central bank to raise rates following the 2001-02 recession. Not only the Fed is highly unlikely to precede any major central bank in raising rates, but any tax holiday from the Obama administration would surely be mimicked by other (as Japan is already proposing).
And so the only durable means for the USD to avoid such developments would be for the US recovery to be consumer-based . But as the transmission mechanism between the bank liquidity and consumer demand remains broken by weak bank lending, continued foreclosures and rising unemployment rates, the demand source for the necessary increase in the next earnings season will remain tepid at best.
No Wrap-up without Reiterating GBP Bearishness
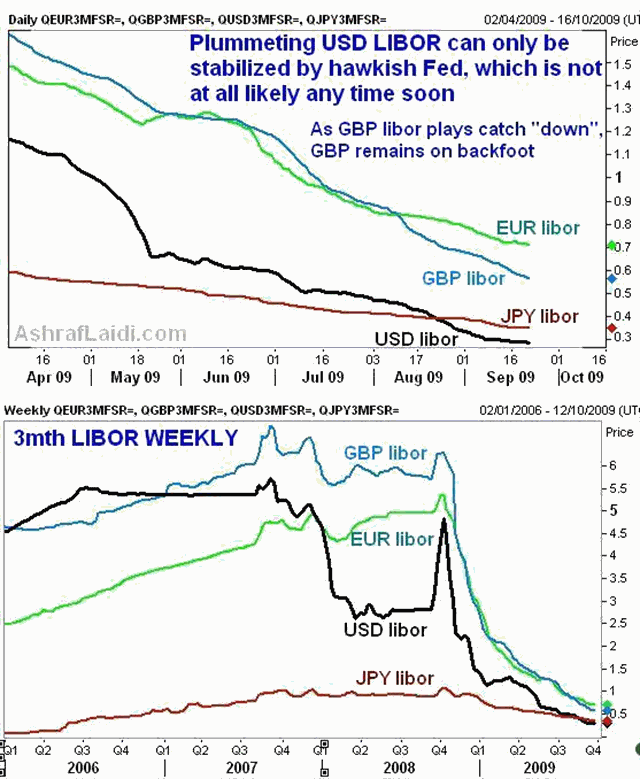
Excluding USD, GBP emerges as the broad underperformer even during improved risk appetite such as today, followed closely by JPY. Plummeting sterling LIBOR rates in the aftermath of bank of England Governor King's "negative interest rate" reminders and Lloyds' failed bid to exit govt asset protection program are likely here to stay especially amid an expected continuation of the BoEs QE.
This suggests that GBPUSD and GBPJPY would re-emerge amid the most notable losers during the next wave of risk aversion (GBPUSD capped at $1.6720 and GBPJPY capped at 153, eyeing 145.05). This would be closely followed by CADJPY, NZDJPY and AUDJPY. The chart of LIBOR rates below cogently illustrate the extent of the speed of USD LIBOR falling below Japan's zero-range rates as well as GBP LIBOR's continued decline, which should soon reside in the territory of JPY and USD.


