Intraday Market Thoughts
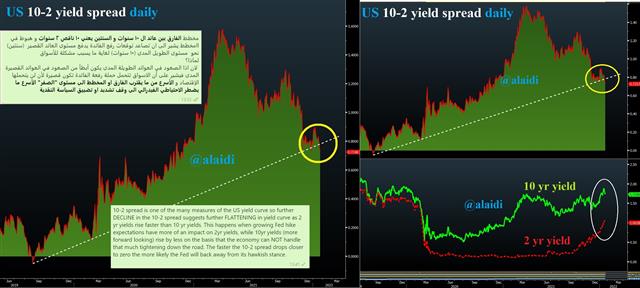
10 2 breaking support? منحنى العوائد
by
Jan 24, 2022 16:29
Friday's post showing a possible top in US 10 year yields goes in line with the 10-2 charts. The left-hand chart shows the deterioration in the 10-2 spread, reflecting further flattening in the yield curve. This is usually a sign of the bond market challenging the Fed's rate hike expectations. Retail traders are often advised to NOT to fight the Fed, but this does NOT APPLY for the bond market, which often fights/challenges the Fed and wins. See full explanation inside the charts.
Click To Enlarge

Latest IMTs
-
Mystery Chart & Coordinated Silver Attack
by Ashraf Laidi | Feb 6, 2026 10:52
-
From 4920 to 5090 and back
by Ashraf Laidi | Feb 5, 2026 9:41
-
How I Nailed $5090oz
by Ashraf Laidi | Feb 4, 2026 11:44
-
2x our Gains in 8 Weeks
by Ashraf Laidi | Feb 3, 2026 10:28
-
4500 and 72 Hit, now what?
by Ashraf Laidi | Feb 2, 2026 2:22


