Intraday Market Thoughts Archives
Displaying results for week of Dec 29, 2019Geopolitics & Manufacturing Seasonals
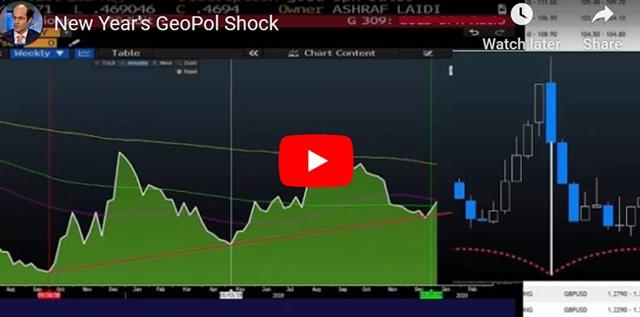
Most global indices are off their lows of the day, but the dangers surrounding the trigger of the selloff are by no means over. Adding to it today's release of the worst US manufacturing ISM reading in over 10 years, and more questions arise. Trump's ordering of the US killing of Iran's most powerful general will pressure Iran into a possible retaliation on US military interests in the region or those of US allies. The 3 cent spike in oil prices, along with the $20 jump in gold, 4% decline in bond yields and 21% jump in the VIX bear the trademark of a geopolitically driven shock to risk appetite. Below is Ashraf's 1st video of the year for Premium subscribers, shedding light on some historic (not historical) developments in relative gold moves and the implications for global markets.
But let's not forget what happened earlier in the week. China cut rates Thursday in a further boost to global growth but PMI readings showed that manufacturing remains in a rut. We continue to keep a close watch on global manufacturing.
The global economy slowed in mid-2019 on the combination of higher interest rates and the trade war. Since then the Fed and others have lowered rates and now we have a ceasefire in the trade war.
Leading vs Lagging

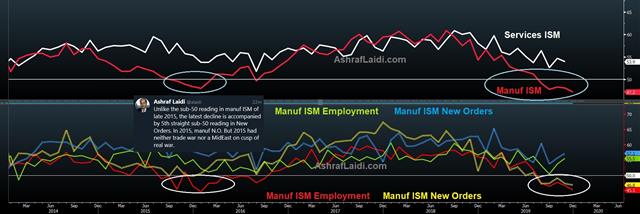
With regards to US manufacturing, Ashraf reminds us that the latest deterioration in manuf ISM stands out from that of 2015 in that it is now joined in contraction territory by the New Orders index, which is a true leading indicator--unlike employment.
Some things like real estate have quickly turned around and stock markets are clearly pricing in more of the same, yet manufacturing is still soft. A few manufacturing surveys were out Thursday and the theme was a continued flatline.
A good spot to watch is the JPMorgan global PMI because it aggregates all the Markit indexes. It started 2018 at 54 then slowly sank to 49.3 into mid-2019. The latest number was out today at 50.1, which is barely expanding and lower than the previous month.
If the theme this year is strengthening global growth then it has to show up in manufacturing. The market probably has 2-3 months of patience as the trade deal, Brexit and rate cuts work their way through but it doesn't begin to materialize, the worries will start.
Hand-in-hand with that goes China. The PBOC cut the RRR by 50 basis points Wednesday and we expect to see a cut in the LPR by 20-30 basis points in Q1. If China continues to stimulate then commodity currencies and commodities stand to benefit.
In terms of seasonals, there are some strong tendencies but lately the trends have faded. The traditional January effect is for stock market strength but that hasn't been true over the past decade. What's more true is that risk trades do well in the first week of the month followed by softness thereafter.
In FX, it's the second weakest month for AUD, CAD and NZD but the past three years have bucked the trend so be wary.
One of the strongest seasonal patterns anywhere is gold in January. It's by far the best month. Oil, meanwhile, tends to soften in January and then rally from Feb through April.
High Yielders Gather Pace
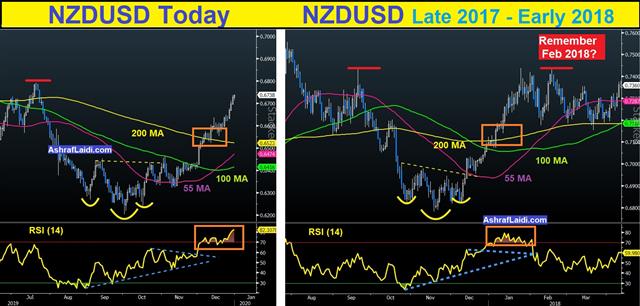
AUD/USD stretches its gain above the 200-day moving average and is currently breaking 0.7000 for the first time since July. The kiwi has risen 200 pips above its 200-DMA, ignoring the pullback in indices. USDJPY dropped 80 pips 24 hrs after Ashraf wrote this about the yen. USDX posts its 3rd worst month in 2 years. Tuesday is New Year's Eve and the only US release is Dec US consumer confidence. Wednesday is off in most markets, but Jan 2nd is business as usual -- with UK and US PMI manufacturing as well as US jobless claims. This is followed by Friday's release of German CPI, US manufacturing ISM and the Fed minutes. Both GBPUSD Premium trades are in the green and 3 new charts have been added. Below, is Ashraf's latest analog chart on NZDUSD.

If there was any lesson in 2019 it was the reminder to follow the lead of central bankers. This year's U-turn at the Fed dominated the landscape and changed everything--from the switch towards rate cuts, to the loud message of no-more rate changes. Australia's central bank had a message of its own late this year as it hit the pause button and cited a 'gentle turning point' in the economy.
With global trade and growth prospects improving, the Australian dollar remains well positioned for further gains, with a bump in the US-China trade talks considered as the only source of adversity. It's not the ideal time of the year to draw conclusions, but AUD/USD is now more than 80 pips above the 200-dma, breaking the Dec and Nov highs. The rally above the 200-dma follows 21-months where AUD/USD never climbed above it. Given the calendar, it still feels premature to chase the rally but if it's a true break, it could be a sign of good things to come.
In the bigger picture, the US dollar looks increasingly vulnerable. The dollar index itself is down 2.6% from the October high and that peak was well-short of the 2016-2017 high.
Looking ahead, the theme continues to be whether we're seeing a skid along the bottom in global growth or a rebound. The market is certainly betting on a rebound but economic data remains soft, especially in manufacturing and trade.
| Act | Exp | Prev | GMT |
|---|---|---|---|
| Chicago PMI | |||
| 48.9 | 48.2 | 46.3 | Dec 30 14:45 |
| PMI | |||
| 50.1 | 50.2 | Dec 31 1:00 | |
| CB Consumer Confidence | |||
| 128.0 | 125.5 | Dec 31 15:00 | |


