That EURGBP Again

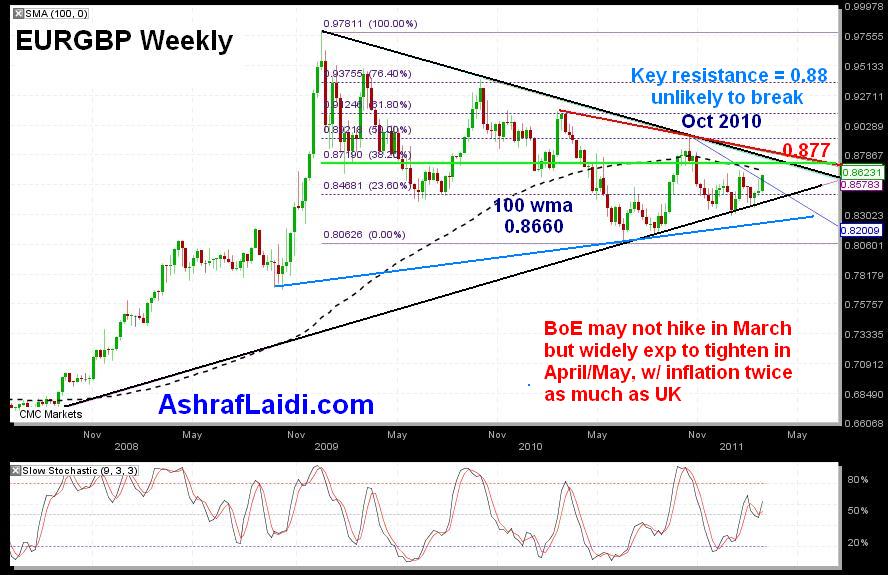
EURGBP broke above the Oct 2010 trendline resistance of 0.86, now facing the next key obstacle at the 100-week MA of 0.8660s last broken since Nov 2010. The pattern of lower-highs remains intact as two major trendlines continue to hold: (i) March 2010 trendine (red) and (ii) Dec 2008 trendline (black), both suggest subsequent pressure point near 0.8770-80s. Positive stochastics on the weekly chart appear to support further upside towards testing the 100-week MA of 0.8660s until the more important barrier of whether 0.8770-80s.
FUNDAMENTALLY, EURGBP is supported in the near-term, especially if the Bank of England makes no surprise and holds rates unchanged. The decision would disappoint some of those who may expect a rate hike as early as this month after the unexpected addition of one more hawkish dissent at last months MPC (Dale joining Weale and Sentence). While leaving rates on hold this week may mean a negative knee-jerk reaction for GBP and a short term bounce in EURGBP towards 0.8700s, it does NOT alter markets pricing of rate hikes at the April and/or May meetings. Upon those expectations, GBP will likely preserve some foundation, hence prevent EURGBP from breaking out i.e. closing above 0.88, which would be deemed as the ultimate break of the major trendline resistance (red).
Also FUNDAMENTALLY--on the EURO side of the story, is the lingering issue of peripheral debt. The latest downgrades of Spain and Ireland were shrugged off, but the possibility of a Portuguese bailout is back up as 10-year bond yields stand above 7% for the 23rd straight day, which is well above the 17-day duration that triggered the bailout of Greece and Ireland. All of these are potential negative dynamics for EUR, which validate the 0.88 resistance, a level, above which EURGBP could consider stops for intermediate targets at 0.85 & 0.8380s.
More Hot-Charts
-

Gold Channel ABC and D
Jan 8, 2026 16:27 | by Ashraf Laidiسأرسل رسالة صوتية و كتابية توضيحية لأعضاء مجموعة الواتساب الخاصة حول هذه المخططات - Will send detailed note on latest parameters to our WhatsApp Bdcst Group - -... -

EURUSD Next
Jan 5, 2026 17:09 | by Ashraf LaidiIf EURUSD holds Monday above 1.17, it will show a hammer candle, supported above the 100-day moving average. -
Gold Next Move
Dec 26, 2025 15:32 | by Ashraf LaidiWill send detailed note on latest parameters to our WhatsApp Bdcst Group - سأرسل رسالة صوتية و كتابية توضيحية لأعضاء مجموعة الواتساب الخاصة حول هذه المخططات - ..


