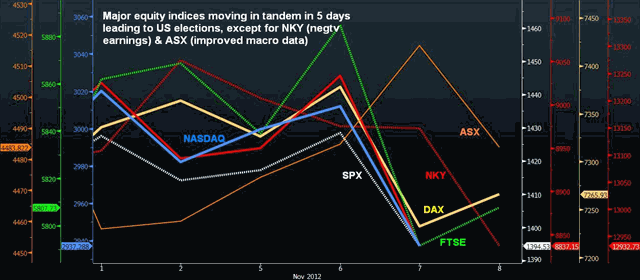
5-Day Overlay of Global Equity Indices

Dow-30 (Wall Street DFT) testing below its 200-DMA of 13000 and whether it will break (close the NY session 22:00 London time) below it will depend on the intensity in selling of other indices. In the case of the S&P500 (US SP 500 DFT), it is trading above its own 200-DMA of 1387 and could well test it as it did in July and June. Remaining cognizant of these levels (13000 in the Dow and 1387 in SP 500), there is a strong likelihood that the levels will be tested on Thursday and Friday. In otherwords, the levels could become a sort of magnet or mean-reversion for the last 2 days of the week. For the Dow, note the previous support of 13040 may act as a resistance or a barrier for intraday bounces. Similarly, for the SP 500, its 4-hour chart suggests prior support of 1410-12, possibly acting as a resistance before a renewed retest of 1383-5.
More Hot-Charts
-

Gold Channel ABC and D
Jan 8, 2026 16:27 | by Ashraf Laidiسأرسل رسالة صوتية و كتابية توضيحية لأعضاء مجموعة الواتساب الخاصة حول هذه المخططات - Will send detailed note on latest parameters to our WhatsApp Bdcst Group - -... -

EURUSD Next
Jan 5, 2026 17:09 | by Ashraf LaidiIf EURUSD holds Monday above 1.17, it will show a hammer candle, supported above the 100-day moving average. -
Gold Next Move
Dec 26, 2025 15:32 | by Ashraf LaidiWill send detailed note on latest parameters to our WhatsApp Bdcst Group - سأرسل رسالة صوتية و كتابية توضيحية لأعضاء مجموعة الواتساب الخاصة حول هذه المخططات - ..


