Revisiting USDNOK

by Ashraf Laidi
Feb 26, 2009 16:03 | 2 Comments

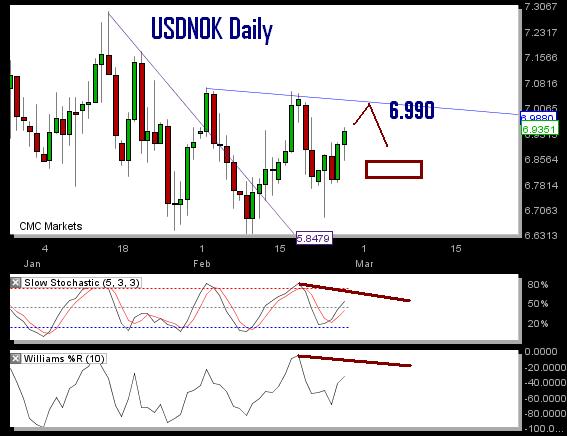
Revisiting USDNOK - USDNOK Feb 26 (Chart 1)

In revisiting the NOK trade, we see a confirmation of the persistent consolidation in the USDNOK pair, albeit, at a narrowing range with a 7.00 trend line resistance and 6.75 support. The last Hot-Chart (Feb 11) supported the case for wide consolidation but the latest decline in the trend line resistance indicates the 6.99 upside may be attained by bullish oscillators, paving the way for the next leg down towards 6.97, 6.90 and 6.78.


More Hot-Charts

  • Bitcoin versus Miners Performance  Chart

    Bitcoin versus Miners Performance

    Apr 9, 2024 16:02 | by Ashraf Laidi
    As many of you know 2023 was kind to members of our WhatsApp Broadcast Group who snapped up shares in bitcoin miners, while 2024 has so far been more superior to Bitcoin than most of the miners...
  • Gold, Bitcoin, USD Combo Chart

    Gold, Bitcoin, USD Combo

    Jun 22, 2023 16:46 | by Ashraf Laidi
    I mentioned last week  on here on how and why both gold and USD are falling together. Since then, the trend accelerated alongside another detail.
  • تفسير مراحل الذهب  Chart

    تفسير مراحل الذهب

    Mar 17, 2023 21:28 | by Ashraf Laidi
    .
Hot-Chart Archives
Comments (Showing latest 2 of 2) View All Comments
Ashraf Laidi
London, UK
Posts: 0
15 years ago
Mar 3, 2009 9:40
Hi Hamish, those are good points. AUD has a more positive correlation with S&P500 than the NOK but the latter. As for AUDNOK, the Aussie has had steady gains over the past 2 weeks reaching the highest since Jan 21. Ive always said i liked AUD and NOK and the Aussie has not disappointed. I now fiind more value in the NOK against USD than AUD. As for further declines in S&P00 such as 600 (which is my forecast for later this summer), this should again be punishing for both currencies against USD but not so negative for them against other commodity currencies and EUR and GBP.
hamish (rookie trader)
vancouver, Canada
Posted Anonymously
15 years ago
Feb 26, 2009 22:13
I would appreciate a hot-chart & a fundamental update for the SP500 as "risk on" currencies, such as NOK & AUD move exactly in tandem with the SP500. It doesn't seem to matter how one interprets a currency chart or its fundamentals as without exception, they appear to follow the SP.

For a position trade such as NOK is there anyway to calculate an upside cap in the event the SP challenges 709 or heaven forbid the mid 600s ? I suppose the market will decide! I am also surprised that the 15% rise in the oil price has had no positive effect on NOK.