



Hot-Charts
How Low Cable
by
Mar 9, 2009 12:34
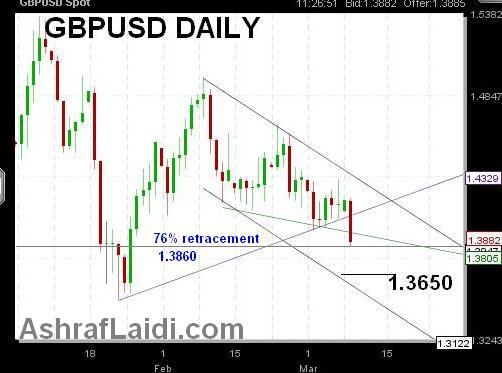
Cable's sell off ensues on the negative news flow from UK banks (latest round of govt nationalization dubbed as insurance and flurry of realized/unrealized banking losses). GBPUSD shrugs the improvement in risk-seeking trades in FX (seen in yen selling) and extends losses towards a 5-week low of $1.3860, which coincides with the 76% retracement of the $1.35-$1.4997 move. A break below this level is to make way for fresh downfall into the $1.3650. $1.3990 and $1.3960 will emerge as key resistance levels in the days ahead.
More Hot-Charts
-
Gold & Nasdaq100
Sep 28, 2026 10:32 | by Ashraf Laidiسأرسل رسالة صوتية و كتابية توضيحية لأعضاء مجموعة الواتساب الخاصة حول هذه المخططات - Will send detailed note on latest parameters to our WhatsApp Bdcst Group... -

Gold & GoldBugs
Sep 24, 2026 11:51 | by Ashraf LaidiIf the inverse relation between gold and goldbugs index explained repeatedly in previous videos such as here and here continues to work, then watching the 4230 level is as important as... -
Nasdaq Part 2
Sep 24, 2026 9:44 | by Ashraf LaidiNow that Nasdaq has fallen following yesterday's post, will it extend declines to 30000. What do you think of this fractal.