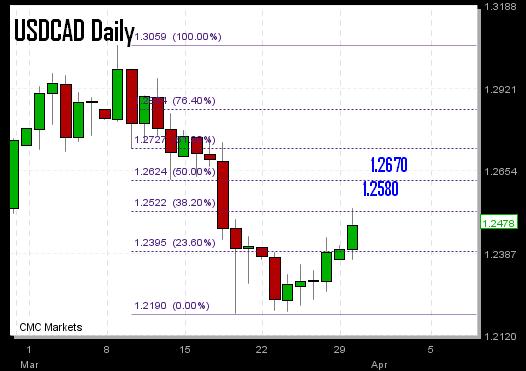
USDCAD Eyes 1.2660s

CAD hastily drops across the board at the first sign of trouble in risk appetite as the broadening sell-off in equities boosts USDCAD past the $1.25. Weve long mentioned the positive correlation involving major equity indices with Aussie and Kiwi pairs. But we also mentioned the relatively high correlation of -0.72 between USDCAD and S&P500 Year-to-Date, suggesting high correlation between CAD and equities. It is too early to expect equities to head back towards March lows at this point, but USDCAD will likely have to re-test 1.25 before calling back 1.2580s and 1.2660s.
More Hot-Charts
-

Mystery Charts
Feb 5, 2026 20:48 | by Ashraf Laidiسأرسل رسالة صوتية و كتابية توضيحية لأعضاء مجموعة الواتساب الخاصة حول هذه المخططات Will send detailed note on latest parameters to our WhatsApp Bdcst Group... -

2hr Gold Chart
Feb 3, 2026 13:09 | by Ashraf Laidiسأرسل رسالة صوتية و كتابية توضيحية لأعضاء مجموعة الواتساب الخاصة حول هذه المخططات Will send detailed note on latest parameters to our WhatsApp Bdcst Group... -

Gold Net Longs
Feb 2, 2026 17:16 | by Ashraf LaidiI really dislike after-the-fact analysis, but looking at this chart of Gold speculative net longs at the Comex, it shows speculators began lightening their longs on Jan 23.


