Hot-Charts
When Bitcoin, Ethereum Shrug USD Strength
by
Aug 10, 2021 18:42
The below analysis was carried out last Friday (Aug 6th), after which both BTC and ETH have risen more than 14% each. The analysis highlight the newfound strength of Bitcoin and Ethereum in a different perspective from the usual analysis on holdings in wallets, exchanges and smart contracts. The fact that both BTC and ETH have rallied recently during periods of USD strength underlines the robustness of the crypto rally as well as its durability. Many have claimed Bitcoin and Ethereum rarely push higher during periods of USD strength. In truth, there is no clear, prolonged negative correlation between the USD index and Ethereum. What I will show, however, is that each time both BTC and ETH gained during the weeks when USD Index rose by at least 0.5% per week, these cases proved to be of considerable strength for BTC, ETH and most cryptocurrencies.
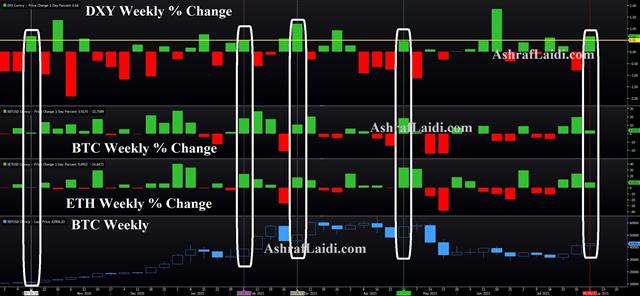
DXY vs BTC vs ETH Oct 2020 to Aug 2021
Click To Enlarge
Click To Enlarge

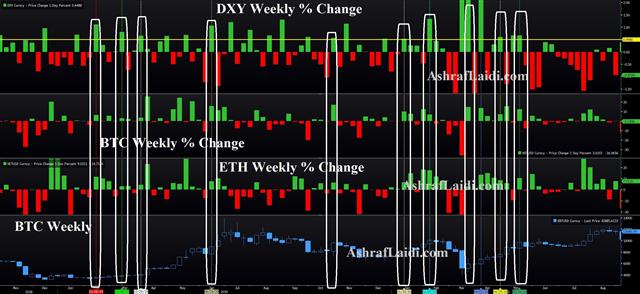
DXY vs BTC vs ETH Nov 2018 to Aug 2021
Click To Enlarge
Click To Enlarge

See it for yourself: In the 1st chart, I've highlighted (in white vertical rectangles) the weeks when DXY rose by at least 0.5% along with a rally in both BTC and ETH. In each of these relatively rare periods, BTC price was in a clear upswing (bottom panel of weekly BTC candles/prices).
Again, it is more likely for ETH and BTC to rally in tandem during USD weakness. But when both ETH and BTC rally despite a strong USD rally (defined as at least +0.5% per week), then we're most likely in a period of real, durable upswing in cryptos—as defined by BTC.
More Hot-Charts
-

EURGBP Channel Test
Jan 22, 2026 13:20 | by Ashraf LaidiEURGBP is on the cusp of a channel breakout. One of the least well known secrets is how this pair correlates with major equity indices. -

Gold Channel ABC and D
Jan 8, 2026 16:27 | by Ashraf Laidiسأرسل رسالة صوتية و كتابية توضيحية لأعضاء مجموعة الواتساب الخاصة حول هذه المخططات - Will send detailed note on latest parameters to our WhatsApp Bdcst Group - -... -

EURUSD Next
Jan 5, 2026 17:09 | by Ashraf LaidiIf EURUSD holds Monday above 1.17, it will show a hammer candle, supported above the 100-day moving average.


