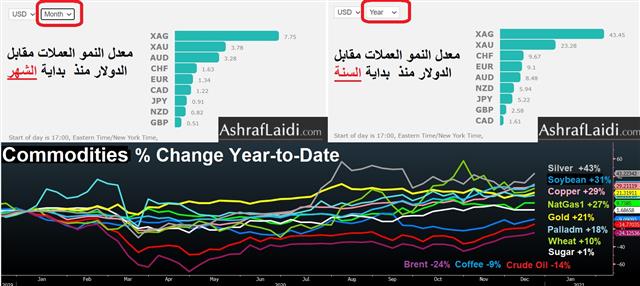
2020 FX & Commodities YTD Performance
What a miserable year for the US dollar. As goes the December as went the year in FX, while silver & soybeans topped commodities, as oil & coffee ranked bottom in the % Change YTD league. The final weeks of the year have shown a clear outperformance of iron ore and silver, followed closely by a sharp ascent in energy---- all typical signs of expectations for a global recovery & further USD damage. Will these markets be right? Will Copper "Mr PhD in Economics" be finally at fault? Will the Medical-Quanttv-Easing of the vaccine swell indices to new heights? Most importantly, will this be accompanied by a boost in nominal yields as well as REAL yields? If inflation does fails to keep up with rising yields, gold and silver may sustain fresh downside. Take a look at this yields chart and stay tuned.

More Hot-Charts
-

Gold Channel ABC and D
Jan 8, 2026 16:27 | by Ashraf Laidiسأرسل رسالة صوتية و كتابية توضيحية لأعضاء مجموعة الواتساب الخاصة حول هذه المخططات - Will send detailed note on latest parameters to our WhatsApp Bdcst Group - -... -

EURUSD Next
Jan 5, 2026 17:09 | by Ashraf LaidiIf EURUSD holds Monday above 1.17, it will show a hammer candle, supported above the 100-day moving average. -
Gold Next Move
Dec 26, 2025 15:32 | by Ashraf LaidiWill send detailed note on latest parameters to our WhatsApp Bdcst Group - سأرسل رسالة صوتية و كتابية توضيحية لأعضاء مجموعة الواتساب الخاصة حول هذه المخططات - ..


