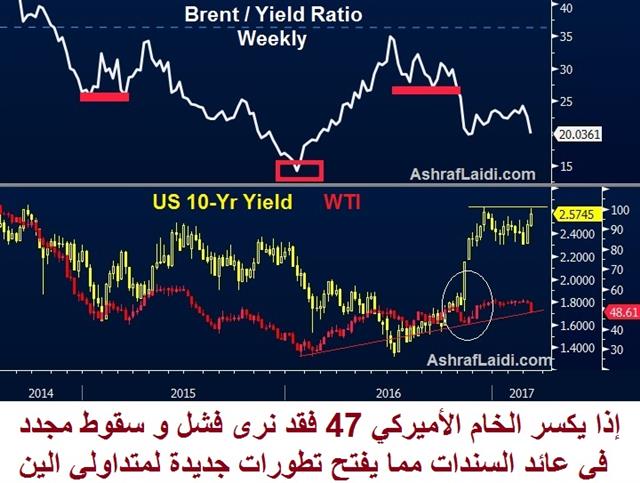
Oil vs Yields
We know that bond yields and oil generally move in the same, but sometimes the relationship breaks down as it did in last Nov-Dec due to powerful USD rally surging with yields to the extent that it dragged down all commodities-including oil. Today, yields' outperformance relative to oil has reached key levels with the 10-yr yield testing crucial resistance and US crude oil (WTI) at important confluence support.

Considering that the Yield/Oil ratio failed to break above the neckline of the inverted H&S formation and is presently heading lower, this could mean yields will break out and oil breaks down, neither breaks but yield retain the relative upper hand, or both pull down (yields fail to break higher but oil breaks down).
If oil weakness remains and/or extends, then the reflation trade would be seriously disrupted, especially if yields fail to make any marked gains above inflation rates. Several scenarios could play out, yet, it's important to keep an eye on 2.60-5% resistance on the 10-year and the $47 support in WTI. An oil break below the latter should inevitably prevent yields from pushing higher, forcing yen traders to closely follow the extent to which yields react to energy. Will cover this in more detail in next week's Premium video after examining the intermarket reaction to the Fed decision/outcome.
More Hot-Charts
-
Updating post 9th
Nov 24, 2025 12:02 | by Ashraf Laidiسأرسل رسالة صوتية و كتابية توضيحية لأعضاء مجموعة الواتساب الخاصة حول هذه المخططات - Will send detailed note on latest parameters to our WhatsApp Bdcst Group - -... -
Indices Support?
Nov 21, 2025 18:07 | by Ashraf Laidiسأرسل رسالة صوتية و كتابية توضيحية لأعضاء مجموعة الواتساب الخاصة حول هذه المخططات - Will send detailed note on latest technical parameters to our WhatsApp Bdcst Group... -

Gold Nasdaq
Nov 20, 2025 8:38 | by Ashraf Laidi.


