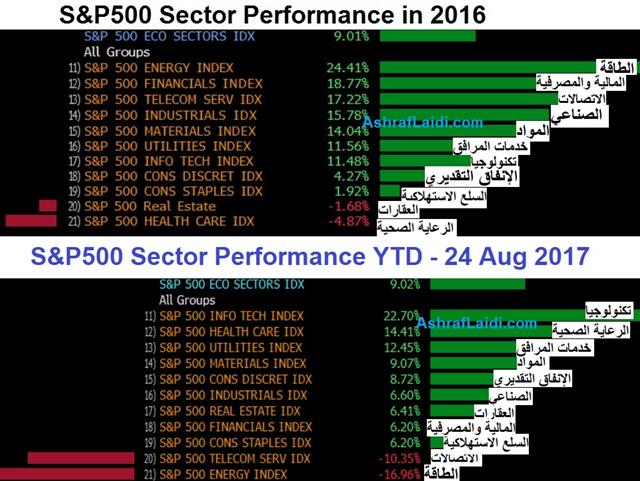
US Stocks Sector Performance
In comparing the year-to-date sector performance for the S&P500 to that of 2016, the 2 most striking developments is the reversal in energy stocks from best performer in 2016 to the worst so far this year and the sharp rebound in healthcare stocks from the worst of 2016 to the 2nd best in heathcare. If utilities are seen as defensive stocks, then why are they are in the top 3? How about technology --the top performer of the year is being manifested in NASDAQ's clear outperformance (+12%) of the S&P500 (+5%) and DOW30 (+6%). Technology overtook heathcare about 1 month ago. But have you seen the NASDAQ chart lately? Lower highs since late July. Keep these relative performance issues in mind.

More Hot-Charts
-
Updating post 9th
Nov 24, 2025 12:02 | by Ashraf Laidiسأرسل رسالة صوتية و كتابية توضيحية لأعضاء مجموعة الواتساب الخاصة حول هذه المخططات - Will send detailed note on latest parameters to our WhatsApp Bdcst Group - -... -
Indices Support?
Nov 21, 2025 18:07 | by Ashraf Laidiسأرسل رسالة صوتية و كتابية توضيحية لأعضاء مجموعة الواتساب الخاصة حول هذه المخططات - Will send detailed note on latest technical parameters to our WhatsApp Bdcst Group... -

Gold Nasdaq
Nov 20, 2025 8:38 | by Ashraf Laidi.


