50% Retracements & USDJPY
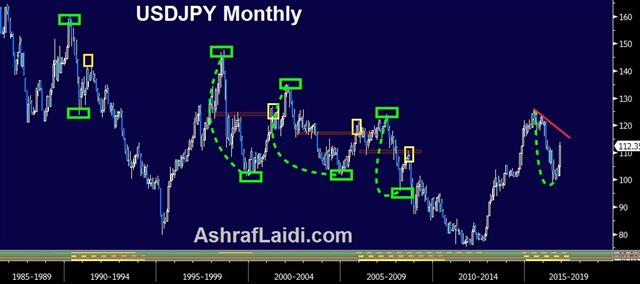
Sharp yen gains overnight were largely the result of the Bank of Japan's offers to buy JGBs as part of its yield-targeting strategy. After falling by nearly 200 pips, USDJPY recovered the 112 handle. Having closed last week above the 50% retracement of the decline from the June 2015 high to the June 2016 low, will the rebound continue? Here are the 4 cases when USDJPY retraced 50% following a decline of 20-30% following a cyclical peak:

1) June 2007 to Mar 2008: -22% USDJPY fell more than 20% from June 2007 high to Mar 2008 low, rebounding more than 50% to Aug 2008, and staying above the retracement for 3 weeks before crashing down over the subsequent 2 years.
2) Feb 2002 to Jan 2005: -25% USDJPY fell 25%, retraced more than 50% in Dec 2005, where it held for 4 weeks before dropping 10%.
3) Aug 1998 to Dec 1999: -31% USDJPY fell more than 30%, retraced a little over 50% in Mar 2001, but lasting 1 week above the retracement before later falling 8%.
4) Apr 1990 to Oct 1990: -23% USDJPY fell 23% then retraced exactly 50%, peaking out in March 1991, before falling 14%.
So what will it be this time? Does the Trump USD-Yields rally propel USD above 115 and onto 118s, or will it 115 mark another barrier above the 50% retracement before triggering fresh selling? A new Premium trade in USDJPY has been posted with detailed charts and rationale.
Latest IMTs
-
2026 Difficult but not Impossible
by Ashraf Laidi | Dec 22, 2025 20:06
-
Bank of Japan Massacre or Yawn?
by Ashraf Laidi | Dec 18, 2025 20:50
-
EURGBP Eyes 8920
by Ashraf Laidi | Dec 17, 2025 19:31
-
Only One Stock سهم واحد فقط
by Ashraf Laidi | Dec 16, 2025 19:58
-
Gold During Recessions & Bear Markets
by Ashraf Laidi | Dec 13, 2025 12:29


