Intraday Market Thoughts
A Perfect Indicator?
by
Nov 18, 2019 22:05
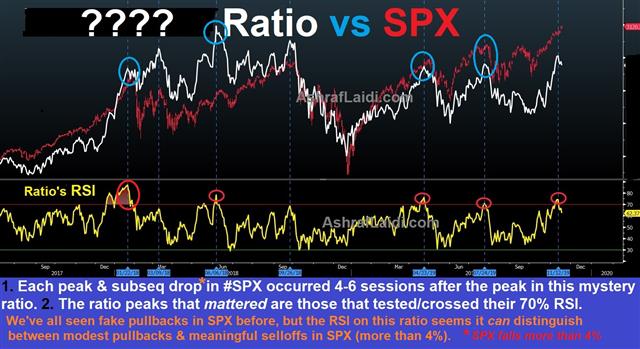
Every once in a while, a chart like this comes around. Each peak and subsequent decline in the S&P500 of more than 5% over the past 2 years was predicted 4-6 sessions prior by this mystery instrument at each occasion the ratio tested 70% on the RSI. Is it as perfect as it appears? Find out more.
Latest IMTs
-
Bank of Japan Massacre or Yawn?
by Ashraf Laidi | Dec 18, 2025 20:50
-
EURGBP Eyes 8920
by Ashraf Laidi | Dec 17, 2025 19:31
-
Only One Stock سهم واحد فقط
by Ashraf Laidi | Dec 16, 2025 19:58
-
Gold During Recessions & Bear Markets
by Ashraf Laidi | Dec 13, 2025 12:29
-
AAOI & the Fed
by Ashraf Laidi | Dec 11, 2025 19:22


